Mapbox 实现复杂功能:加载地图、标记点筛选、hover标记点时添加动效、区域边界线、提示弹窗
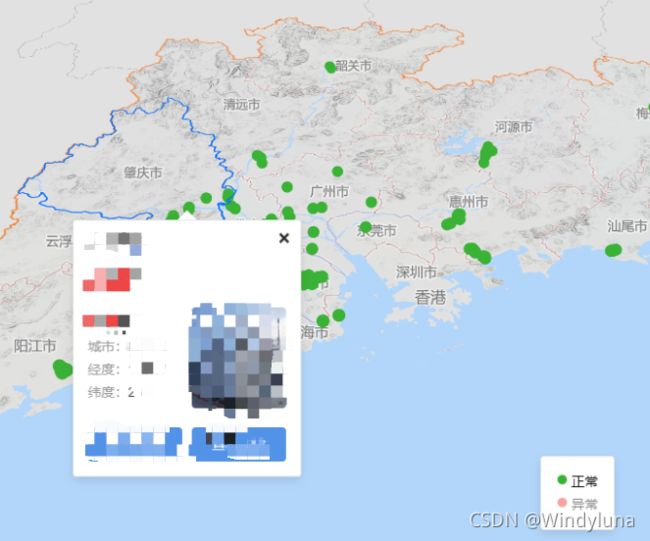
一、效果图:
二、功能拆分
(1)显示地图
(2)加载地图标记点、点击该标记点出现该标记点的详情弹窗、筛选标记点
(3)加载区域范围边界线、hover该区域时出现边界线、点击该区域出现该区域提示信息
(4)如果标记点和区域范围上的点击事件重合:
参考方案:mapbox两个图层叠加,点击重合部分都触发事件解决方案
(5)hover 标记点时改变标记点颜色及样式思路:
加载完地图,在添加标记点图层时,再添加一个图层作为hover标记点后的效果图层,初始隐藏掉该图层,当鼠标移到到该位置点时将它显示出来,鼠标移出该位置点时将它隐藏掉。
(6)鼠标点击区域某一点,将该点置于地图中心,并将该点所在的区域放大:
使用 map.jumpTo() 、map.flyTo() 方法
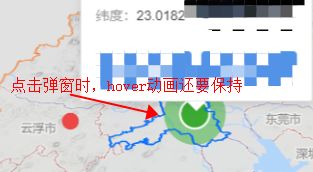
(7)监听弹窗何时打开、关闭事件: 当弹窗打开时,hover标记点保持hover状态,当弹窗关闭时,hover标记点消失。
参考方案:Mapbox GL JS收听弹出式开放事件?
let popup = new mapboxgl.Popup()
popup.on('close', function(e) {
    alert()
})
popup.on('open', function(e) {
    alert()
})
(8)将标注改为中文:
官网:源代码
参考:vue 集成mapbox gl并设置中文语言
三、实现步骤
1、显示地图
<div ref="basicMapbox" style="width:400px; height:400px">div>
data(){
  mapInst: '',
  // 组件加载后隐藏
  showInfoWindow: false,
  popupTemp: null,
  lengeData: {
    lev1_show: true,
    lev2_show: true,
  },
  visible: false,
  mapDataCopy: JSON.parse(JSON.stringify(this.mapData)),
  currentMarkers: [], //标记点集合
  attrAndColor: [],
},
methods:{
  // 初始化
  init() {
    //加载地图
    mapboxgl.accessToken = 'pk.eyJ1Ijoxxxxxxx0NTYiLCJhIjoiY2tqbWtlemR5MGt4MTJ4bjBxcjNmcng5NCJ9.GRpGEmZhxJ58EkNW6Ta_AQ'
    this.mapInst = new mapboxgl.Map({
      container: this.$refs.basicMapbox,
      style: 'https://xxxxxxxxctor-styles/mapbox/mapbox-light.json',
      center: [113.34411, 23.141], // 地图初始化时的地理中心点
      zoom: 6.4, // 初始缩放比
      bearing: 0,
      pitch: 45,
    })
    // 给地图添加交互
    this.loadSourceStyle()
  },
}
2、加载地图标记点、点击该标记点出现该标记点的详情弹窗、筛选标记点
(1)加载地图标记点
mapbox-gl提供了两种在地图上创建poi方式:使用图层(Layers)中的symbol样式,另一种是使用Marker的形式,图层的数据源是geojson数据,Marker是以坐标点的形式加载到地图上。
两者区别:
采用图层方式是为了在标记点上添加交互:鼠标点击、悬浮等事件
坐标点方式:可以在标记点上添加另外标记点
注意:使用图层添加标记点,则需要将后台接口返回的标记点JSON格式(数组)更改为 geojson格式 (对象)
本文添加多个标记点使用添加图层方式;当hover该标记点时出现另外的标记时采用坐标点形式,参考上一篇Mapbox 添加标记点(一)使用 forEach循环遍历添加标记点 。
(2)点击标记点出现详情弹窗
该弹窗内容样式多,比较复杂,如果使用官网上那种方式不好操作。所以将弹框内容抽出组件,然后在 mapbox 中挂载自定义组件 点我查看实现方式
(3) 筛选标记点
使用 map.setFilter('site-point', filterShow) 方法:
'site-point' 是标记点的图层id,
filterShow 是筛选条件(使用mapbox的表达式)
let filterShow = ['in', 'status', '0', '1'] 表示:筛选出数据中参数为 status ,值为 ‘0’ 和 ‘1’ 的标记点
3、加载区域范围边界线、hover该区域时出现边界线、点击该区域出现该区域提示信息
参考上一篇文章:Mapbox 绘制区域边界线 鼠标悬停效果 vue
4、处理标记点和区域范围上的点击事件重合
5、hover标记点时标记点放大效果
6、鼠标点击区域某一点,将该点置于地图中心,并将该点所在的区域放大
官网:将地图居中于被单击的符号上
// 点击放大该区域
that.mapInst.jumpTo({
  around: Number(e.lngLat.lng),
  zoom: 9,
})
// 将地图居中于被单击的点上
that.mapInst.flyTo({ center: [Number(e.lngLat.lng), Number(e.lngLat.lat)] })
7、当弹窗打开时,hover标记点保持hover状态,当弹窗关闭时,hover标记点消失
var isShow = false //弹窗是否关闭
// 监听弹窗关闭事件:取消hover时的标记点
pointPopup.on('close', function (e) {
  that.mapInst.setFilter('point-hover', ['==', 'name', ''])
  isShow = false
})
pointPopup.on('open', function (e) {
  isShow = true
})
四、核心代码
methods: {
  // 初始化
  init() {
    mapboxgl.accessToken = 'pk.eyJ1IjoibWVpaW4xMjM0NTYxxxxxxxIjoiYxxxxxx2tqbWtlemR5MGt4MTJ4bjBxcjNmcng5NCJ9.GRpGEmZhxJ58EkNW6Ta_AQ'
    this.mapInst = new mapboxgl.Map({
      container: this.$refs.basicMapbox,
      style: 'https://xxxxxxx.cn/vector-styles/mapbox/mapbox-light.json',
      center: [113.34411, 23.141], // 地图初始化时的地理中心点
      zoom: 6.4, // 初始缩放比
      bearing: 0,
      pitch: 45,
    })
    this.loadSourceStyle()
  },
  loadSourceStyle() {
    let that = this

    // hover时标记
    var size = 200
    var pulsingDot_1 = {
      width: size,
      height: size,
      data: new Uint8Array(size * size * 4),

      onAdd: function () {
        var canvas = document.createElement('canvas')
        canvas.width = this.width
        canvas.height = this.height
        this.context = canvas.getContext('2d')
      },

      render: function () {
        var duration = 1000
        var t = (performance.now() % duration) / duration

        var radius = (size / 2) * 0.3
        var outerRadius = (size / 2) * 0.7 * t + radius
        var context = this.context

        // draw outer circle
        context.clearRect(0, 0, this.width, this.height)
        context.beginPath()
        context.arc(this.width / 2, this.height / 2, outerRadius, 0, Math.PI * 2)
        context.fillStyle = 'rgba(58,178,54,' + (1 - t) + ')'
        context.fill()

        // draw inner circle
        context.beginPath()
        context.arc(this.width / 2, this.height / 2, radius, 0, Math.PI * 2)
        context.fillStyle = 'rgba(58,170,50, 1)'
        context.strokeStyle = 'white'
        context.lineWidth = 2 + 4 * (1 - t)
        context.fill()
        context.stroke()

        // update this image's data with data from the canvas
        this.data = context.getImageData(0, 0, this.width, this.height).data

        // keep the map repainting
        that.mapInst.triggerRepaint()

        // return `true` to let the map know that the image was updated
        return true
      },
    }

    var pulsingDot_2 = {
      width: size,
      height: size,
      data: new Uint8Array(size * size * 4),

      onAdd: function () {
        var canvas = document.createElement('canvas')
        canvas.width = this.width
        canvas.height = this.height
        this.context = canvas.getContext('2d')
      },

      render: function () {
        var duration = 1000
        var t = (performance.now() % duration) / duration

        var radius = (size / 2) * 0.3
        var outerRadius = (size / 2) * 0.7 * t + radius
        var context = this.context

        // draw outer circle
        context.clearRect(0, 0, this.width, this.height)
        context.beginPath()
        context.arc(this.width / 2, this.height / 2, outerRadius, 0, Math.PI * 2)
        context.fillStyle = 'rgba(255,209,209,' + (1 - t) + ')'
        context.fill()

        // draw inner circle
        context.beginPath()
        context.arc(this.width / 2, this.height / 2, radius, 0, Math.PI * 2)
        context.fillStyle = 'rgba(236,70,70, 1)'
        context.strokeStyle = 'white'
        context.lineWidth = 2 + 4 * (1 - t)
        context.fill()
        context.stroke()

        // update this image's data with data from the canvas
        this.data = context.getImageData(0, 0, this.width, this.height).data

        // keep the map repainting
        that.mapInst.triggerRepaint()

        // return `true` to let the map know that the image was updated
        return true
      },
    }

    that.mapInst.on('load', function () {
      // 加载点位--start
      that.mapInst.addSource('site', {
        type: 'geojson',
        data: pointJson,
        // data: that.mapData,
      })
      that.mapInst.addLayer({
        id: 'site-point',
        type: 'circle',
        source: 'site',
        layout: {},
        filter: ['!', ['has', 'point_count']],
        paint: {
          'circle-color': ['match', ['get', 'status'], '0', '#3AB236', '1', '#EC4646', /* 其他*/ '#ccc'],
          'circle-radius': ['match', ['get', 'status'], '0', 7, '1', 9, /* 其他*/ 30],
        },
      })

      // 添加hover时标记 --start
      that.mapInst.addImage('pulsing-dot-1', pulsingDot_1, { pixelRatio: 2 })
      that.mapInst.addImage('pulsing-dot-2', pulsingDot_2, { pixelRatio: 2 })
      that.mapInst.addLayer({
        id: 'point-hover',
        type: 'symbol',
        source: 'site',
        filter: ['==', 'name', ''],
        layout: {
          'icon-image': ['match', ['get', 'status'], '0', 'pulsing-dot-1', '1', 'pulsing-dot-2', /* 其他*/ 'pulsing-dot-1'],
        },
      })
      //添加hover时标记 --end

      // 站点弹窗
      var pointPopup = new mapboxgl.Popup({
        closeButton: true,
        closeOnClick: true,
      })
      var isShow = false //弹窗是否关闭
      // 监听弹窗关闭事件:取消hover时的标记点
      pointPopup.on('close', function (e) {
        that.mapInst.setFilter('point-hover', ['==', 'name', ''])
        isShow = false
      })
      pointPopup.on('open', function (e) {
        isShow = true
      })

      that.mapInst.on('click', 'site-point', function (e) {
        e.preventDefault() //阻止默认事件

        let latLongData = [Number(e.lngLat.lng), Number(e.lngLat.lat)]
        let detailInfo = e.features[0].properties
        detailInfo.deviceVoList = JSON.parse(detailInfo.deviceVoList)
        // 点击出现弹窗
        const popDetail = Vue.extend(InfoWindow)
        let vm = new popDetail({
          propsData: {
            detailInfo: detailInfo,
          },
        })
        vm.$mount() //挂载
        pointPopup.setLngLat(latLongData).setDOMContent(vm.$el).addTo(that.mapInst)
      })

      let hoveredPointId = null

      that.mapInst.on('mousemove', 'site-point', function (e) {
        that.mapInst.getCanvas().style.cursor = 'pointer' // 设定鼠标移入的样式  小手模式pointer

        if (hoveredPointId) {
          that.mapInst.setFilter('point-hover', ['==', 'name', e.features[0].properties.name])
        }
        hoveredPointId = e.features[0].properties.id
      })

      that.mapInst.on('mouseleave', 'site-point', function () {
        that.mapInst.getCanvas().style.cursor = 'default'
        hoveredPointId = null
        //弹窗关闭,隐藏hover时标记点
        if (isShow === false) {
          that.mapInst.setFilter('point-hover', ['==', 'name', ''])
        }
      })

      // 加载点位--end

      // 绘制区域线--start
      let hoveredStateId = null
      // 加载区域边界geojson数据文件
      that.mapInst.addSource('states', {
        type: 'geojson',
        data: geoJson,
      })
      // 给区域绘制边框线
      that.mapInst.addLayer({
        id: 'state-borders',
        type: 'line',
        source: 'states',
        layout: {},
        paint: {
          'line-color': '#006EFF',
          'line-width': 2,
        },
        /* (1)filter:过滤器,名字name为空的数据才显示,也就是默认不使用该layer; 效果:在鼠标悬停的时候才显示该区域的边界线。 (2)反之,如果不设置filter,则显示所有区域的边界线   */
        filter: ['==', 'name', ''],
      })
      // // 给区域范围填充背景颜色
      that.mapInst.addLayer({
        id: 'state-fills',
        type: 'fill',
        source: 'states',
        layout: {},
        paint: {
          'fill-color': '#006EFF',
          'fill-outline-color': '#006EFF',
          'fill-opacity': ['case', ['boolean', ['feature-state', 'hover'], false], 0, 0], // hover时区域背景色、区域背景色
        },
      })
      // 城市区域站房提示弹窗
      var popup = new mapboxgl.Popup({
        closeButton: false,
        closeOnClick: false,
      })
      //鼠标悬停事件
      that.mapInst.on('mousemove', 'state-fills', function (e) {
        that.mapInst.getCanvas().style.cursor = 'default' // 设定鼠标移入的样式  小手模式pointer
        if (e.features.length > 0) {
          if (hoveredStateId) {
            // setFeatureState 和 setFilter 是两种不同的写法(都可以)
            // // hover时给该区域填充颜色
            that.mapInst.setFeatureState({ source: 'states', id: hoveredStateId }, { hover: false })
            // hover时出现区域边界线
            that.mapInst.setFilter('state-borders', ['==', 'name', e.features[0].properties.name]) /* 通过设置filter更新要显示的数据,即出现鼠标悬停之后的变色效果 */
          }
          hoveredStateId = e.features[0].id // ps:加载的geoJson  feature 里面必须设定一个id 属性,用于定位哪个区域需要高亮。如果原文件没有,可以手动在原文件上添加id 属性并设置对应的id 数字
        } else {
          popup.remove()
          return
        }
      })

      that.mapInst.on('mouseleave', 'state-fills', function () {
        that.mapInst.getCanvas().style.cursor = '' //改变鼠标样式
        if (hoveredStateId) {
          that.mapInst.setFeatureState({ source: 'states', id: hoveredStateId }, { hover: false })
          that.mapInst.setFilter('state-borders', ['==', 'name', '']) /* 鼠标移开时还原layer的过滤器 */
        }
        hoveredStateId = null
      })

      that.mapInst.on('click', 'state-fills', function (e) {
        if (e._defaultPrevented === true) {
          return
        }

        that.mapInst.getCanvas().style.cursor = 'default'
        let latLongData = [Number(e.lngLat.lng), Number(e.lngLat.lat)]

        if (e.features.length > 0) {
          hoveredStateId = e.features[0].id // ps:加载的geoJson  feature 里面必须设定一个id 属性,用于定位哪个区域需要高亮。如果原文件没有,可以手动在原文件上添加id 属性并设置对应的id 数字
          that.mapInst.setFeatureState({ source: 'states', id: hoveredStateId }, { hover: false })

          // 鼠标hover 时 弹窗显示区域的介绍信息
          popup
            .setLngLat(latLongData)
            .setHTML(
              `

                 ${e.features[0].properties.name}
                站房:35个
                异常:1个


          `
            )
            .addTo(that.mapInst)

          // 点击放大该区域
          that.mapInst.jumpTo({
            around: Number(e.lngLat.lng),
            zoom: 9,
          })
          // 将地图居中于被单击的点上
          that.mapInst.flyTo({ center: [Number(e.lngLat.lng), Number(e.lngLat.lat)] })
        } else {
          popup.remove()
          return
        }
      })
      that.mapInst.on('mouseover', 'state-fills', function () {
        that.mapInst.getCanvas().style.cursor = '' //改变鼠标样式
        popup.remove() //鼠标移开去掉弹窗
      })
      // 绘制区域线--end
    })
  },
  // 筛选标记点:正常、异常
  changePoint(val) {
    if (val == '0') {
      this.lengeData.lev1_show = !this.lengeData.lev1_show
    }
    if (val == '1') {
      this.lengeData.lev2_show = !this.lengeData.lev2_show
    }

    let filterShow = []
    if (this.lengeData.lev1_show === true && this.lengeData.lev2_show === true) {
      // 显示出正常、异常
      filterShow = ['in', 'status', '0', '1']
    } else if (this.lengeData.lev1_show === true && this.lengeData.lev2_show === false) {
      // 只显示出正常
      filterShow = ['in', 'status', '0']
    } else if (this.lengeData.lev1_show === false && this.lengeData.lev2_show === false) {
      // 正常异常都不显示
      filterShow = ['in', 'status', '2']
    } else if (this.lengeData.lev1_show === false && this.lengeData.lev2_show === true) {
      // 只显示出异常
      filterShow = ['in', 'status', '1']
    }

    // 筛选地图标记点
    this.mapInst.setFilter('site-point', filterShow)
  },
},


