1、bar 柱状图
import matplotlib.pyplot as plt
import numpy as np
n=12
x=np.arange(12)
y1=(1-x/float(n))*np.random.uniform(0.5,1,n)
y2=(1-x/float(n))*np.random.uniform(0.5,1,n)
plt.xlim(-.5,n)
plt.ylim(-1.25,1.25)
plt.xticks([])
plt.yticks([])
plt.bar(x,y1,facecolor='b',edgecolor='white')
plt.bar(x,-y2,facecolor='pink',edgecolor='white')
for x,y1,y2 in zip(x,y1,y2):
    plt.text(x,y1,'%.2f' %y1,ha='center',va='bottom')
    plt.text(x,-y2,'%.2f' %y2,ha='center',va='top')
plt.show()

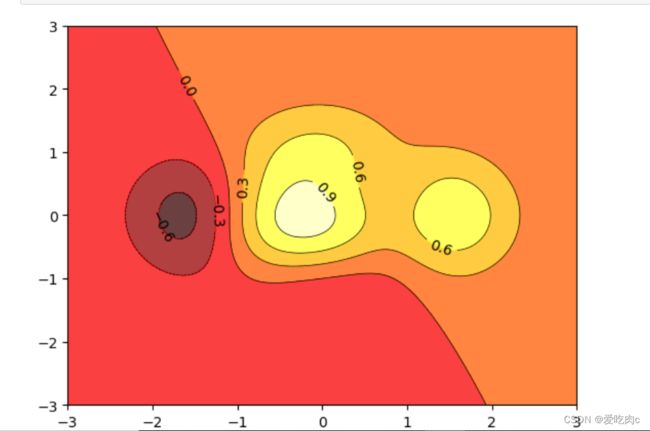
2、contour 等高线
import matplotlib.pyplot as plt
import numpy as np
n=256
def f(x,y):
    return (1-x/2+x**5+y**3)*np.exp(-x**2-y**2)
x=np.linspace(-3,3,n)
y=np.linspace(-3,3,n)
X,Y=np.meshgrid(x,y) #生成格点坐标用来计算曲面每个点的数值,然后才可以进行显示 可以打印出看X,Y与xy的区别。
plt.contourf(X,Y,f(X,Y),5,alpha=0.75,cmap=plt.cm.hot)  #5 代表6个线 #contuorf= contour filling 代表填充
C=plt.contour(X,Y,f(X,Y),5,colors='black',linewidths=0.5)  #画等高线
plt.clabel(C,inline=True,fontsize=10) #c=contour label 等高线标签 inline 是否画在线内
plt.show()

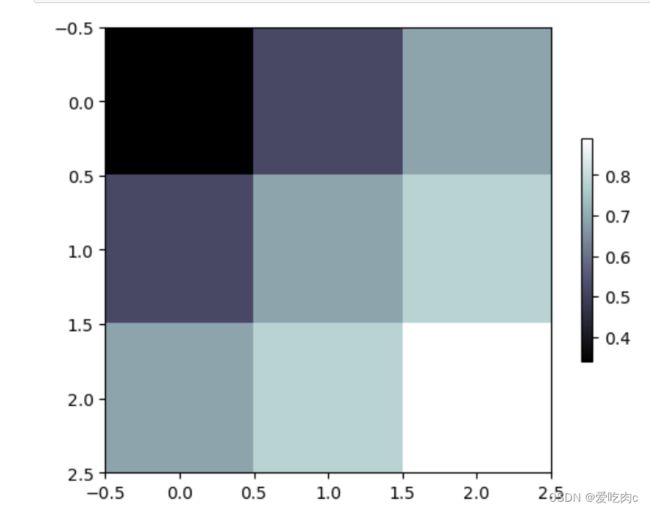
3、plt.imshow()
a=np.array([0.34,0.52,0.69,0.52,0.69,0.78,0.69,0.78,0.89]).reshape(3,3)
plt.imshow(a,interpolation='nearest',cmap=plt.cm.bone,origin='upper')
plt.colorbar(shrink=0.5)  #shrink 压缩
plt.show()


