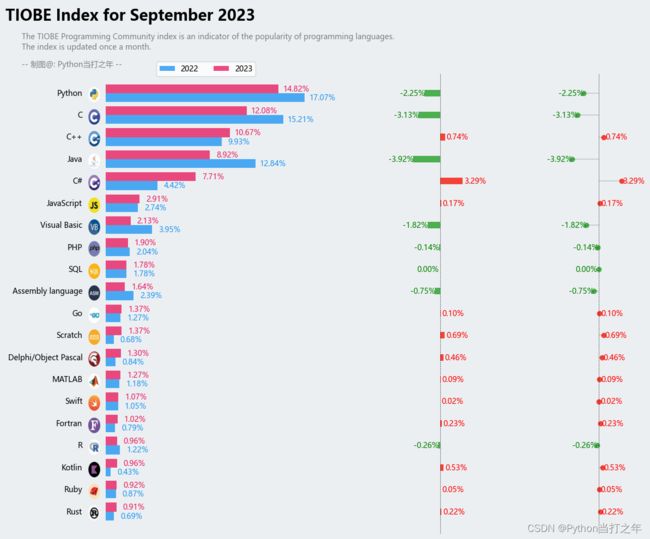
Matplotlib | 高阶绘图案例【4】- 2023年编程语言榜单Python稳坐第一
文章目录
- ️ 1. 导入模块
- ️ 2. 数据处理
-
- 2.1 高效数据
- 2.2 保留需要的列
- ️ 3. 绘图
-
- 3.1 绘制图布,添加3个子图
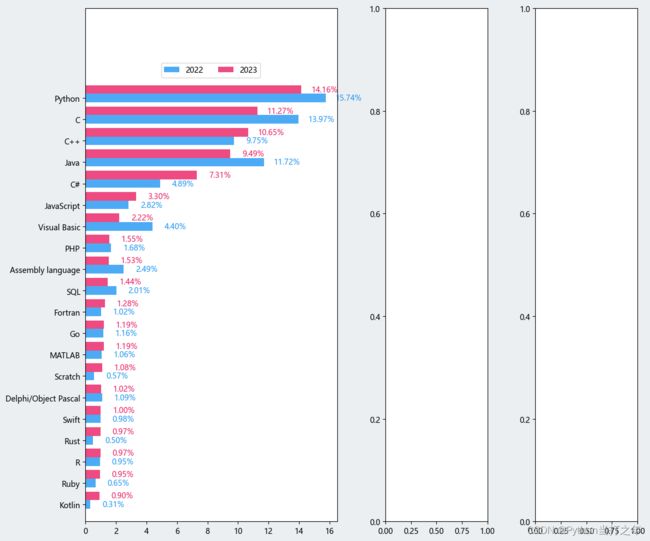
- 3.2 绘制子图1条形图
- 3.3 子图1条形图添加数据标签
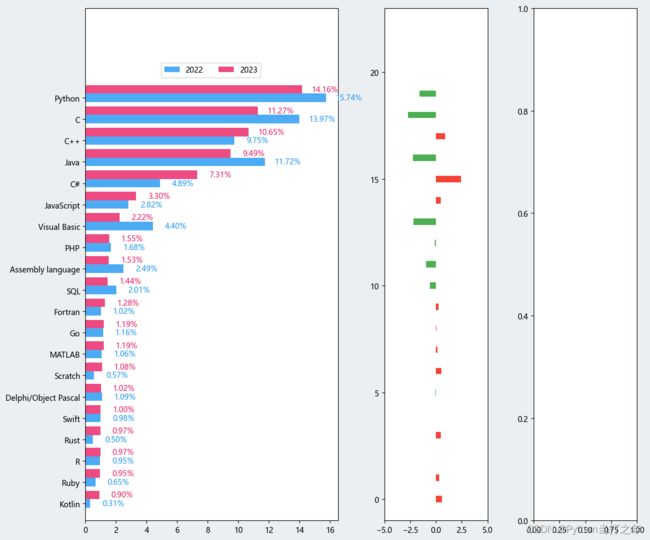
- 3.4 绘制子图2条形图
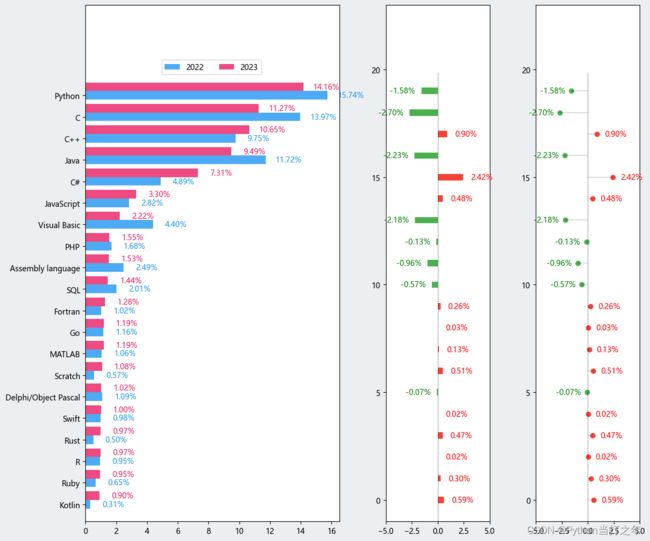
- 3.5 子图2添加轴线和数值
- 3.6 绘制子图3散点图
- 3.7 添加图标、标题
- ️ 4. 在线运行地址
- ️ 5. 可视化项目源码+数据
大家好,我是 【Python当打之年(点击跳转)】
本期是 Matplotlib高阶绘图案例系列 的第 4 期, Matplotlib系列和Pyecharts系列都会不间断更新,希望对大家有所帮助,如有疑问或者需要改进的地方可以联系小编。
往期:
Matplotlib | 高阶绘图案例【3】
Matplotlib | 高阶绘图案例【2】
Matplotlib | 高阶绘图案例【1】
️ 1. 导入模块
import pandas as pd
import matplotlib.pyplot as plt
from matplotlib.offsetbox import OffsetImage,AnnotationBbox
import matplotlib.image as mpimg

import warnings
warnings.filterwarnings('ignore')
plt.rcParams['font.sans-serif'] = ['Microsoft YaHei']
️ 2. 数据处理
2.1 高效数据
数据获取:https://www.tiobe.com/tiobe-index/
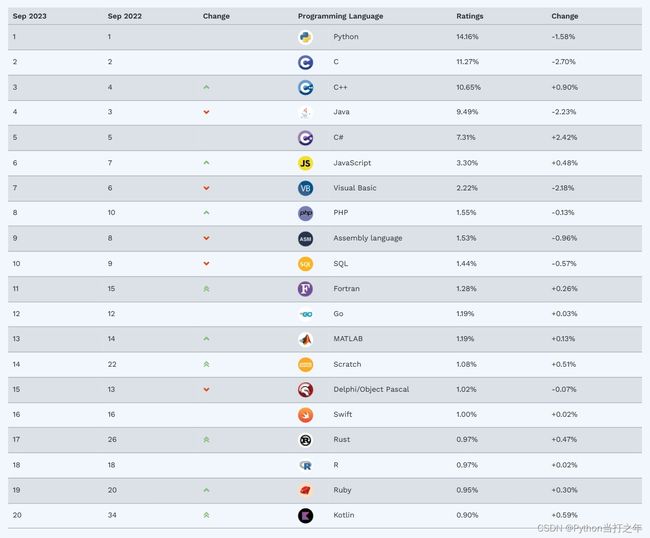
这里我们只用pandas.read_html直接读取网页表格数据:
dfs = pd.read_html("https://www.tiobe.com/tiobe-index/", encoding='utf-8',header=0)
df = dfs[0].copy()
2.2 保留需要的列
df['Ratings'] = df['Ratings'].str.strip('%').astype(float)
df['Change.1'] = df['Change.1'].str.strip('%').astype(float)
df1 = df[['Sep 2023', 'Sep 2022', 'Programming Language.1', 'Ratings', 'Change.1']]
df1['Ratings2'] = df1['Ratings']-df1['Change.1']
df1.columns = ['Sep 2023', 'Sep 2022', 'Programming Language', 'Ratings_2023', 'Change','Ratings_2022']
️ 3. 绘图
3.1 绘制图布,添加3个子图
fig = plt.figure(figsize=(12,10),layout='tight',facecolor='#ECEFF1',dpi=100)
gs = fig.add_gridspec(1,4)
ax1=fig.add_subplot(gs[0,:2])
ax2=fig.add_subplot(gs[0,2])
ax3=fig.add_subplot(gs[0,3])
3.2 绘制子图1条形图
x_data1 = [i-0.2 for i in x_data]
ax1.barh(x_data1, y_data1,height=0.4,tick_label=labels,label='2022',alpha=0.8,color='#2196F3')
x_data2 = [i+0.2 for i in x_data]
ax1.barh(x_data2, y_data2, height=0.4,label='2023',alpha=0.8,color='#E91E63')
plt.show()
3.3 子图1条形图添加数据标签
for x, y, lable in zip(y_data1,x_data1,labels):
    ax1.text(x + 1.5, y, '%.2f' % x + '%', ha='center', va='center',color='#2196F3')
3.4 绘制子图2条形图
ax2.set_ylim(-1,y_lim)
ax2.set_xlim(-5,5)
for i in range(len(y_data3)):
    ax2.barh(x_data[i],y_data3[i],color='#F44336' if y_data3[i]>0 else '#4CAF50',height=0.3)
plt.show()
3.5 子图2添加轴线和数值
ax2.axvline(0,0,0.87,lw=0.5,ls='--',c='k',alpha=0.8)
for i in range(len(y_data3)):
    if y_data3[i]>0:
        ax2.text(y_data3[i]+1.8, x_data[i], '%.2f' % y_data3[i] + '%', ha='center', va='center',color='r')
    else:
        ax2.text(y_data3[i]-1.8, x_data[i], '%.2f' % y_data3[i] + '%', ha='center', va='center',color='g')
plt.show()
3.6 绘制子图3散点图
ax3.scatter(y_data3,x_data,c='#F44336' if y_data3[i]>0 else '#4CAF50',s=50, linewidth=0)
ax3.axvline(0,0,0.87,lw=0.5,ls='--',c='k',alpha=0.8)
plt.show()
3.7 添加图标、标题
️ 4. 在线运行地址
在线运行地址(全部代码):
https://www.heywhale.com/mw/project/6520bed0c6bc713b13d04154
️ 5. 可视化项目源码+数据
点击跳转:【全部可视化项目源码+数据】
以上就是本期为大家整理的全部内容了,赶快练习起来吧,原创不易,喜欢的朋友可以点赞、收藏也可以分享(注明出处)让更多人知道。
