echarts中横向柱状图的数字在条纹上方
实现效果: 数字在条纹的上方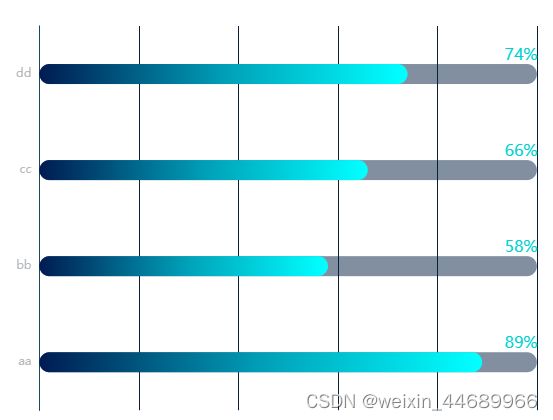
实现方法:这些数字是用新添加一个坐标轴来实现的
直接添加坐标轴数字显示是在条纹的正右边
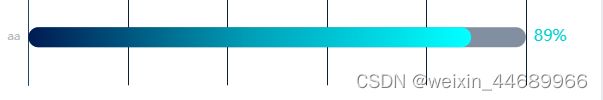
所以需要配置一下偏移
完整代码
var option = {
      grid: {
        left: "3%",
        right: "4%",
        bottom: "3%",
        containLabel: true,
      },
      xAxis: {
        type: "value",
        boundaryGap: [0, 0.01],
        axisLine: {
          show: false,
        },
        axisLabel: {
          show: false,
        },
        splitLine: {
          show: true,
          lineStyle: {
            color: "#121f33",
          },
        },
      },
      yAxis: [
        {
          type: "category",
          data: ["aa", "bb", "cc", "dd"],

          axisLine: {
            show: true,
            lineStyle: {
              color: "#2a4661",
            },
          },
          axisTick: {
            show: false,
          },
          axisLabel: {
            color: "#b8babd",
          },
        },
        {
          type: "category",
          position: "right",
          offset: -40,
          inverse: false,
          axisTick: "none",
          axisLine: "none",
          show: true,
          axisLabel: {
            textStyle: {
              height: 30,
              width: 30,
              padding: [0, 0, 10, 0],
              color: "#03d0d4",
              fontSize: "16",
            },
          },
          //------------------右侧展示的具体内容----------------------------
          data: [
            {
              value: "89%",
              textStyle: {
                color: "#03ced1",
                verticalAlign: "bottom",
              },
            },
            {
              value: "58%",
              textStyle: {
                color: "#03ced1",
                verticalAlign: "bottom",
              },
            },
            {
              value: "66%",
              textStyle: {
                color: "#03ced1",
                verticalAlign: "bottom",
              },
            },
            {
              value: "74%",
              textStyle: {
                color: "#03ced1",
                verticalAlign: "bottom",
              },
            },
          ],
        },
      ],
      series: [
        {
          type: "bar",
          showBackground: true,
          backgroundStyle: {
            color: "rgba(13, 32, 66, 0.5)",
            borderRadius: 10,
          },
          itemStyle: {
            color: new echarts.graphic.LinearGradient(0, 0, 1, 0, [
              { offset: 0, color: "#021a52" },
              { offset: 0.5, color: "#019cb5" },
              { offset: 1, color: "#00fdfe" },
            ]),
            borderRadius: 10,
          },
          barWidth: "20",

          data: [89, 58, 66, 74],
        },
      ],
    };
放在实例中运行即可
https://echarts.apache.org/examples/zh/editor.html?c=pie-simple