【python】数据可视化——pyecharts
pyecharts介绍
Pyecharts 是一个基于 Python 的开源数据可视化库,用于创建各种交互式的图表和可视化效果。它是在 Echarts 的基础上进行封装和优化,Echarts 是一个流行的 JavaScript 数据可视化库。
Pyecharts 提供了直观、易用且美观的图表,包括折线图、柱状图、散点图、饼图、雷达图、地图等多种类型。它具有以下特点:
- 简洁的 API 设计,使用如丝滑般流畅,支持链式调用
- 囊括了 30+ 种常见图表,应有尽有
- 支持主流 Notebook 环境,Jupyter Notebook 和 JupyterLab
- 可轻松集成至 Flask,Django 等主流 Web 框架
- 高度灵活的配置项,可轻松搭配出精美的图表
- 详细的文档和示例,帮助开发者更快的上手项目
- 多达 400+ 地图文件以及原生的百度地图,为地理数据可视化提供强有力的支持
pyecharts安装
pip install pyecharts -i https://pypi.tuna.tsinghua.edu.cn/simple
import pyecharts
print(pyecharts.__version__)	#2.0.4
官网教程:https://pyecharts.org/#/zh-cn/
链式调用
from pyecharts.charts import Bar
from pyecharts.faker import Faker
bar = Bar()
bar.add_xaxis(Faker.dogs)
bar.add_yaxis("狗狗数量", [3, 1, 10, 5, 9, 8, 3])
bar.render("pyecharts_intro.html")
pyecharts 所有方法均支持链式调用。
#链式调用
from pyecharts.charts import Bar
from pyecharts.faker import Faker

bar = (
    Bar()
    .add_xaxis(Faker.dogs)
    .add_yaxis("狗狗数量", [3, 1, 10, 5, 9, 8, 3])
)
bar.render("pyecharts_intro.html")
配置项
全局配置项
官网说明:https://pyecharts.org/#/zh-cn/global_options
源码:External Libraries——>site-packages——>pyecharts——>options——>global_options.py
全局配置项常⽤包括:
InitOpts:初始化配置项
ToolboxOpts:工具箱配置项
TitleOpts:标题配置项
DataZoomOpts:区域缩放配置项
LegendOpts:图例配置项
TooltipOpts:提示框配置项
AxisTickOpts: 坐标轴刻度配置项
AxisOpts:坐标轴配置项
系列配置项
官网说明:https://pyecharts.org/#/zh-cn/series_options
源码:External Libraries——>site-packages——>pyecharts——>options——>series_options.py
系列配置项常⽤包括:
ItemStyleOpts:图元样式配置项
TextStyleOpts:⽂字样式配置项
LabelOpts:标签配置项
LineStyleOpts:线样式配置项
SplitLineOpts:分割线配置项
MarkPointItem:标记点数据项
MarkPointOpts:标记点配置项
MarkLineItem:标记线数据项
MarkLineOpts:标记线配置项
MarkAreaItem: 标记区域数据项
MarkAreaOpts: 标记区域配置项
EffectOpts:涟漪特效配置项
AreaStyleOpts:区域填充样式配置项
SplitAreaOpts:分隔区域配置项
MinorTickOpts:次级刻度配置项
MinorSplitLineOpts:次级分割线配置项
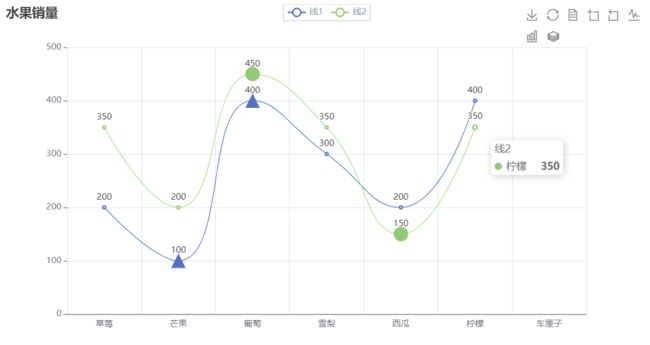
折线图
import pyecharts.options as opts
from pyecharts.faker import Faker
from pyecharts.charts import Line

x_data = Faker.fruits
y1_data = [200, 100, 400, 300, 200, 400]
y2_data = [350, 200, 450, 350, 150, 350]

line = (
    Line()
    # 全局配置项
    .set_global_opts(
        # 标题配置项
        title_opts=opts.TitleOpts(title="水果销量", pos_left="left"),
        # 提示框配置项
        tooltip_opts=opts.TooltipOpts(is_show=True),
        # 图例配置项
        legend_opts=opts.LegendOpts(border_radius=0,
                                    textstyle_opts=opts.TextStyleOpts(color="#90979c")),
        # 坐标轴配置项
        xaxis_opts=opts.AxisOpts(axistick_opts=opts.AxisTickOpts(is_show=False)),
        yaxis_opts=opts.AxisOpts(type_="value",
                                 # 坐标轴刻度配置项
                                 axistick_opts=opts.AxisTickOpts(is_show=True),
                                 # 分割线配置项
                                 splitline_opts=opts.SplitLineOpts(is_show=True)),
        # 工具箱配置项
        toolbox_opts=opts.ToolboxOpts(is_show=True),
    )
    .add_xaxis(xaxis_data=x_data)
    .add_yaxis(series_name="线1", y_axis=y1_data, is_smooth=True,
               markpoint_opts=opts.MarkPointOpts(
                   data=[opts.MarkPointItem(type_='max', name='最大值'),
                         opts.MarkPointItem(type_='min', name='最小值')],
                   symbol='triangle', symbol_size=[20, 20],
                   label_opts=opts.LabelOpts(is_show=False))
               )
    .add_yaxis(series_name="线2", y_axis=y2_data, is_smooth=True,
               # 标记点配置项
               markpoint_opts=opts.MarkPointOpts(
                   # 标记点数据项
                   data=[opts.MarkPointItem(type_='max', name='最大值'),
                         opts.MarkPointItem(type_='min', name='最小值')],
                   symbol='circle', symbol_size=[20, 20],
                   # 标签配置项
                   label_opts=opts.LabelOpts(is_show=False))
               )
)

line.render("折线图.html")
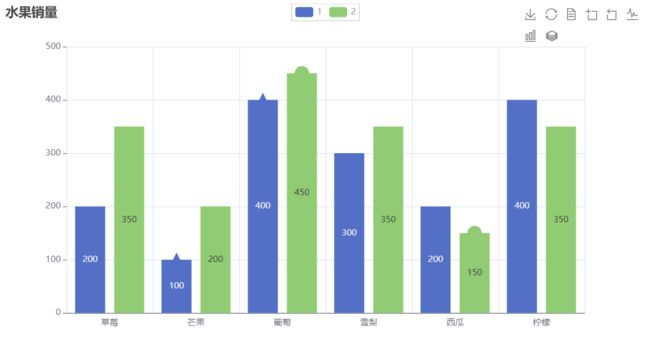
柱状图
import pyecharts.options as opts
from pyecharts.faker import Faker
from pyecharts.charts import Bar

x_data = Faker.fruits[:6]
y1_data = [200, 100, 400, 300, 200, 400]
y2_data = [350, 200, 450, 350, 150, 350]

bar = (
    Bar()
    # 全局配置项
    .set_global_opts(
        # 标题配置项
        title_opts=opts.TitleOpts(title="水果销量", pos_left="left"),
        # 提示框配置项
        tooltip_opts=opts.TooltipOpts(is_show=True),
        # 图例配置项
        legend_opts=opts.LegendOpts(border_radius=0,
                                    textstyle_opts=opts.TextStyleOpts(color="#90979c")),
        # 坐标轴配置项
        xaxis_opts=opts.AxisOpts(axistick_opts=opts.AxisTickOpts(is_show=False)),
        yaxis_opts=opts.AxisOpts(type_="value",
                                 # 坐标轴刻度配置项
                                 axistick_opts=opts.AxisTickOpts(is_show=True),
                                 # 分割线配置项
                                 splitline_opts=opts.SplitLineOpts(is_show=True)),
        # 工具箱配置项
        toolbox_opts=opts.ToolboxOpts(is_show=True),
    )
    .add_xaxis(xaxis_data=x_data)
    .add_yaxis(series_name="1", y_axis=y1_data,
               markpoint_opts=opts.MarkPointOpts(
                   data=[opts.MarkPointItem(type_='max', name='最大值'),
                         opts.MarkPointItem(type_='min', name='最小值')],
                   symbol='triangle', symbol_size=[20, 20],
                   label_opts=opts.LabelOpts(is_show=False))
               )
    .add_yaxis(series_name="2", y_axis=y2_data,
               # 标记点配置项
               markpoint_opts=opts.MarkPointOpts(
                   # 标记点数据项
                   data=[opts.MarkPointItem(type_='max', name='最大值'),
                         opts.MarkPointItem(type_='min', name='最小值')],
                   symbol='circle', symbol_size=[20, 20],
                   # 标签配置项
                   label_opts=opts.LabelOpts(is_show=False))
               )
)

bar.render("柱状图.html")
散点图
import pyecharts.options as opts
from pyecharts.faker import Faker
from pyecharts.charts import Scatter

x_data = Faker.fruits[:6]
y1_data = [200, 100, 400, 300, 200, 400]
y2_data = [350, 200, 450, 350, 150, 350]

scatter = (
    Scatter()
    # 全局配置项
    .set_global_opts(
        # 标题配置项
        title_opts=opts.TitleOpts(title="水果销量", pos_left="left"),
        # 提示框配置项
        tooltip_opts=opts.TooltipOpts(is_show=True),
        # 图例配置项
        legend_opts=opts.LegendOpts(border_radius=0,
                                    textstyle_opts=opts.TextStyleOpts(color="#90979c")),
        # 坐标轴配置项
        xaxis_opts=opts.AxisOpts(axistick_opts=opts.AxisTickOpts(is_show=False)),
        yaxis_opts=opts.AxisOpts(type_="value",
                                 # 坐标轴刻度配置项
                                 axistick_opts=opts.AxisTickOpts(is_show=True),
                                 # 分割线配置项
                                 splitline_opts=opts.SplitLineOpts(is_show=True)),
        # 工具箱配置项
        toolbox_opts=opts.ToolboxOpts(is_show=True),
    )
    .add_xaxis(xaxis_data=x_data)
    .add_yaxis(series_name="1", y_axis=y1_data,
               markpoint_opts=opts.MarkPointOpts(
                   data=[opts.MarkPointItem(type_='max', name='最大值'),
                         opts.MarkPointItem(type_='min', name='最小值')],
                   symbol='triangle', symbol_size=[20, 20],
                   label_opts=opts.LabelOpts(is_show=False))
               )
    .add_yaxis(series_name="2", y_axis=y2_data,
               # 标记点配置项
               markpoint_opts=opts.MarkPointOpts(
                   # 标记点数据项
                   data=[opts.MarkPointItem(type_='max', name='最大值'),
                         opts.MarkPointItem(type_='min', name='最小值')],
                   symbol='circle', symbol_size=[20, 20],
                   # 标签配置项
                   label_opts=opts.LabelOpts(is_show=False))
               )
)

scatter.render("散点图.html")
饼状图、环状图
import pyecharts.options as opts
from pyecharts.faker import Faker
from pyecharts.charts import Pie

fruits = Faker.fruits[:6]
num =[15, 9, 5, 21, 27, 12]

pie =(
    Pie()
    .set_global_opts(
        # 标题配置项
        title_opts=opts.TitleOpts(title='水果占比',pos_bottom=0,pos_left='center'),
        # 提示框配置项
        tooltip_opts=opts.TooltipOpts(is_show=True),
        # 工具箱配置项
        toolbox_opts=opts.ToolboxOpts(is_show=True),
    )
    .set_series_opts(
        #  饼图、仪表盘、漏斗图: {a}(系列名称),{b}(数据项名称),{c}(数值), {d}(百分比)
        label_opts=opts.LabelOpts(formatter="{b}:{c}")
    )
    .add('',[list(i) for i in zip(fruits,num)], radius=["40%", "80%"])

)
pie.render("饼、环状图.html")
词云
import pyecharts.options as opts
from pyecharts.faker import Faker
from pyecharts.charts import WordCloud
import numpy as np

dogs= Faker.dogs[:7]
x = np.random.randint(1,10,size=7).tolist()

wordcloud = (
    WordCloud()
    .set_global_opts(
        # 标题配置项
        title_opts=opts.TitleOpts(title='动物词云', pos_bottom=50, pos_left='center'),
        # 提示框配置项
        tooltip_opts=opts.TooltipOpts(is_show=True),
        # 工具箱配置项
        toolbox_opts=opts.ToolboxOpts(is_show=False),
    )

    # shap默认为cicrle,其他形状有circle, cardioid, diamond, triangle-forward, triangle, pentagon, star
    .add('', [list(i) for i in zip(dogs, x)], shape='cardioid')
)
wordcloud.render('词云.html')


