在图表中添加图例plt.legend()
【小白从小学Python、C、Java】
【计算机等考+500强证书+考研】
【Python-数据分析】
在图表中添加图例
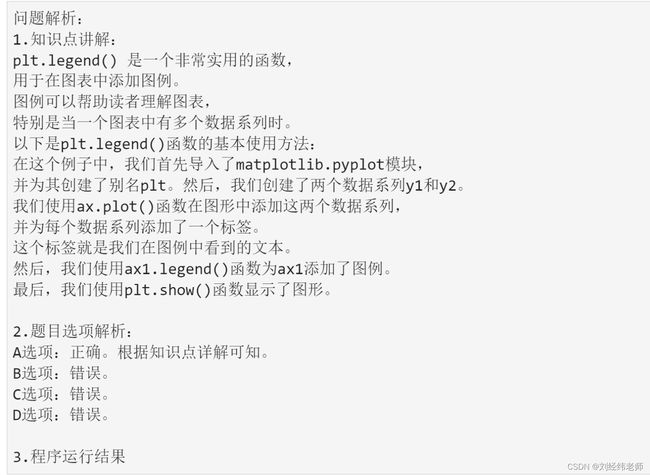
plt.legend()
plt.legend的作用是?
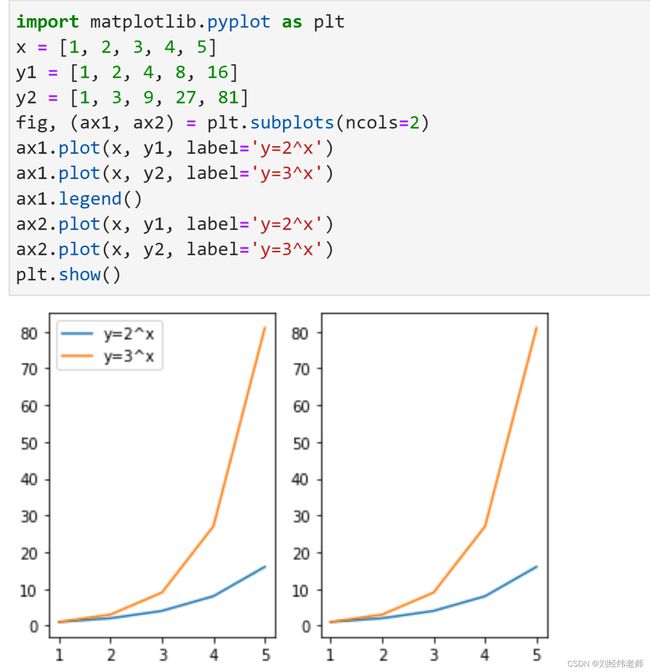
import matplotlib.pyplot as plt
x = [1, 2, 3, 4, 5]
y1 = [1, 2, 4, 8, 16]
y2 = [1, 3, 9, 27, 81]
fig, (ax1, ax2) = plt.subplots(ncols=2)
ax1.plot(x, y1, label='y=2^x')
ax1.plot(x, y2, label='y=3^x')
ax1.legend()
ax2.plot(x, y1, label='y=2^x')
ax2.plot(x, y2, label='y=3^x')
plt.show()
A选项:添加图例
B选项:绘制子图
C选项:添加标题
D选项:添加轴标签
题目解析
示例代码
正确答案是A

