跟着Nature Communications学作图:纹理柱状图+添加显著性标签!
文章目录
- 复现图片
- 设置工作路径和加载相关R包
- 读取数据集
- 数据可视化
-
- 计算均值和标准差
- 计算均值和标准差
-
- 方差分析
- 组间t-test
- 图a可视化过程
- 图b可视化过程
- 合并图ab
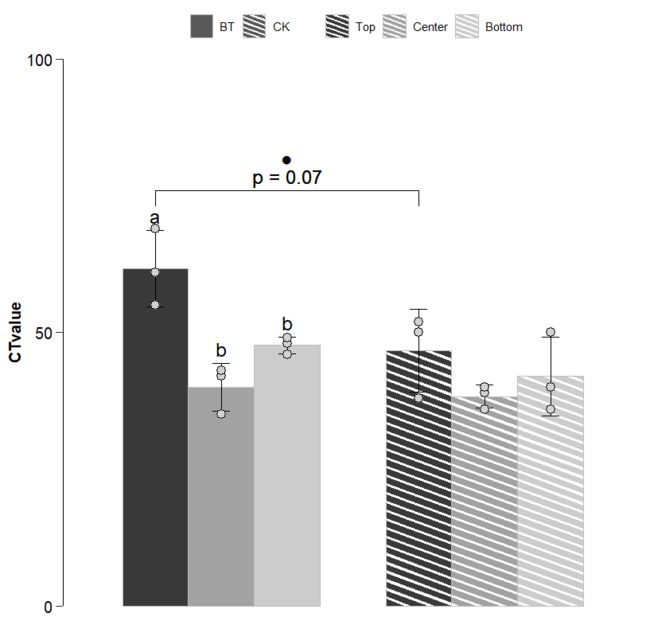
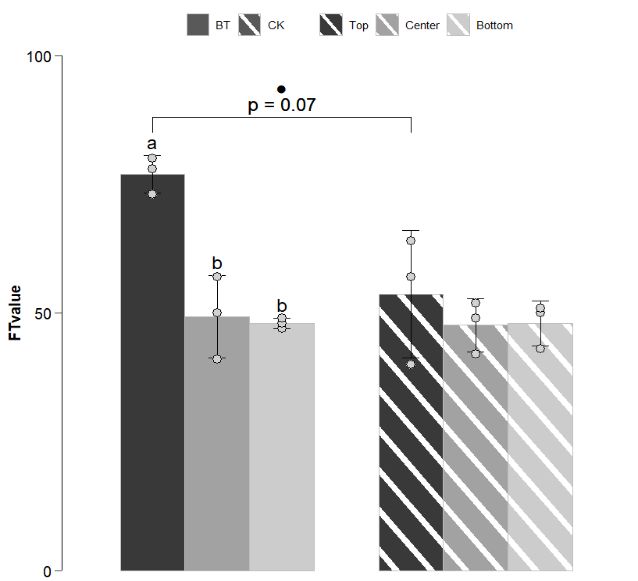
跟着「Nature Communications」学作图,今天主要通过复刻NC文章中的一张主图来巩固先前分享过的知识点,比如纹理柱状图、 添加显著性标签、拼图等,其中还会涉及数据处理的相关细节和具体过程。
复现图片

主要复现红框部分,右侧的cd图与框中的图是同类型的,只不过需要构建更多数据相对麻烦,所以选择以左侧红框图进行学习和展示。
设置工作路径和加载相关R包
rm(list = ls()) # 清空当前环境变量
setwd("C:/Users/Zz/Desktop/公众号 SES") # 设置工作路径
# 加载R包
library(ggplot2)
library(agricolae)
library(ggpattern)
library(ggpubr)
读取数据集
cData1 <- read.csv("cData1.csv", header = T, row.names = 1)
head(cData1)
#   Type   Deep ctValue ftValue Stripe_Angle
# 1   BT    Top      55      73          135
# 2   BT    Top      61      78          135
# 3   BT    Top      69      80          135
# 4   BT Center      35      50          135
# 5   BT Center      42      41          135
# 6   BT Center      43      57          135
数据包括以下指标:2个分类变量、2个数值变量、和1个整数变量。
数据可视化
在可视化前,我们需要先思考图中构成的元素,由哪些组成。
- 计算每个分组或处理下的均值和标准差;
- 进行组内的方差分析及多重比较;
- 进行组间的t检验;
计算均值和标准差
cData1_mean <- cData1 %>%
  gather(key = "var_type", value = "value",
         3:4) %>%
  group_by(Type, Deep, var_type, Stripe_Angle) %>%
  summarise(mean = mean(value),
            sd = sd(value))
cData1_mean
# A tibble: 12 × 6
# Groups:   Type, Deep, var_type [12]
# Type  Deep   var_type Stripe_Angle  mean    sd
#
# 1 BT    Bottom ctValue           135  47.7  1.53
# 2 BT    Bottom ftValue           135  48    1
# 3 BT    Center ctValue           135  40    4.36
# 4 BT    Center ftValue           135  49.3  8.02
# 5 BT    Top    ctValue           135  61.7  7.02
# 6 BT    Top    ftValue           135  77    3.61
# 7 CK    Bottom ctValue           135  42    7.21
# 8 CK    Bottom ftValue           135  48    4.36
# 9 CK    Center ctValue           135  38.3  2.08
# 10 CK    Center ftValue           135  47.7  5.13
# 11 CK    Top    ctValue           135  46.7  7.57
# 12 CK    Top    ftValue           135  53.7 12.3
计算均值和标准差
cData_summary <- cData %>%
  group_by(Weeks, Type) %>%
  summarise(
    avg_lfValue = mean(lfValue),
    sd_lfValue = sd(lfValue),
    avg_rgValue = mean(rgValue),
    sd_rgValue = sd(rgValue),
  )
cData_summary
# Weeks Type               avg_lfValue sd_lfValue avg_rgValue sd_rgValue
#
# 1    20 By week of onset         2623.       25.2        1.98     0.0764
# 2    20 By week of testing       2500        50          1.42     0.104
# 3    21 By week of onset         3543.       40.4        1.74     0.0361
# 4    21 By week of testing       2737.       51.3        1.21     0.0361
# 5    22 By week of onset         2770        26.5        1.28     0.0300
# 6    22 By week of testing       2160        60          1.10     0.0839
# 7    23 By week of onset         2143.       40.4        1.31     0.0208
# 8    23 By week of testing       1777.       75.1        1.02     0.0153
# 9    24 By week of onset         1823.       25.2        1.15     0.0300
# 10    24 By week of testing       1667.       61.1        1.07     0.0265
# 11    25 By week of onset         1690        36.1        1.23     0.0208
# 12    25 By week of testing       1610        36.1        1.2      0.0300
# 13    26 By week of onset         1607.       30.6        1.18     0.0252
# 14    26 By week of testing       1673.       30.6        1.16     0.0361
方差分析
# 方差分析
groups <- NULL
vl <- unique((cData1 %>%
                gather(key = "var_type", value = "value", 3:4) %>%
                unite("unique_col", c(Type, var_type), sep = "-"))$unique_col)
vl

for(i in 1:length(vl)){
  df <- cData1 %>%
    gather(key = "var_type", value = "value", 3:4) %>%
    unite("unique_col", c(Type, var_type), sep = "-") %>%
    filter(unique_col == vl[i])
  aov <- aov(value ~ Deep, df)
  lsd <- LSD.test(aov, "Deep", p.adj = "bonferroni") %>%
    .$groups %>% mutate(Deep = rownames(.),
                        unique_col = vl[i]) %>%
    dplyr::select(-value) %>% as.data.frame()
  groups <- rbind(groups, lsd)
}
groups <- groups %>% separate(unique_col, c("Type", "var_type"))
groups
#         groups   Deep Type var_type
# Top          a    Top   BT  ctValue
# Bottom       b Bottom   BT  ctValue
# Center       b Center   BT  ctValue
# Top1         a    Top   CK  ctValue
# Bottom1      a Bottom   CK  ctValue
# Center1      a Center   CK  ctValue
# Top2         a    Top   BT  ftValue
# Center2      b Center   BT  ftValue
# Bottom2      b Bottom   BT  ftValue
# Top3         a    Top   CK  ftValue
# Bottom3      a Bottom   CK  ftValue
# Center3      a Center   CK  ftValue
使用aov函数和LSD.test函数实现方差分析及对应的多重比较,并提取显著性字母标签。
然后将多重比较的结果与原均值标准差的数据进行合并:
cData1_mean1 <- left_join(cData1_mean, groups, by = c("Deep", "Type", "var_type")) %>%
  arrange(var_type) %>% group_by(Type, var_type) %>%
  mutate(label_to_show = n_distinct(groups))
cData1_mean1
# A tibble: 12 × 8
# Groups:   Type, var_type [4]
# Type  Deep   var_type Stripe_Angle  mean    sd groups label_to_show
#
# 1 BT    Bottom ctValue           135  47.7  1.53 b                  2
# 2 BT    Center ctValue           135  40    4.36 b                  2
# 3 BT    Top    ctValue           135  61.7  7.02 a                  2
# 4 CK    Bottom ctValue           135  42    7.21 a                  1
# 5 CK    Center ctValue           135  38.3  2.08 a                  1
# 6 CK    Top    ctValue           135  46.7  7.57 a                  1
# 7 BT    Bottom ftValue           135  48    1    b                  2
# 8 BT    Center ftValue           135  49.3  8.02 b                  2
# 9 BT    Top    ftValue           135  77    3.61 a                  2
# 10 CK    Bottom ftValue           135  48    4.36 a                  1
# 11 CK    Center ftValue           135  47.7  5.13 a                  1
# 12 CK    Top    ftValue           135  53.7 12.3  a                  1
- 需要注意的是:这里添加了label_to_show一列,目的是为了后续再进行字母标签添加时可以识别没有显著性的结果。
组间t-test
cData1_summary <- cData1 %>%
  gather(key = "var_type", value = "value", 3:4) %>%
  # unite("unique_col", c(Type, Deep), sep = "-") %>% unique_col
  group_by(Deep, var_type) %>%
  summarize(
    p_value = round(t.test(value ~ Type)$p.value, 2)
  ) %>%
  mutate(
    label = ifelse(p_value <= 0.001, "***",
                   ifelse(p_value <= 0.01, "**",
                          ifelse(p_value <= 0.05, "*",
                                 ifelse(p_value <= 0.1, "●", NA))))
  )
cData1_summary
# Deep   var_type p_value label
#
# 1 Bottom ctValue     0.31 NA
# 2 Bottom ftValue     1    NA
# 3 Center ctValue     0.59 NA
# 4 Center ftValue     0.78 NA
# 5 Top    ctValue     0.07 ●
# 6 Top    ftValue     0.07 ●
我们将计算出来的p值,并用* 或者 ●进行了赋值。然后合并相关结果:
cData1_summary1 <- left_join(cData1_mean1, cData1_summary, by = c("Deep", "var_type"))
cData1_summary1
# Type  Deep   var_type Stripe_Angle  mean    sd groups label_to_show p_value label
#
# 1 BT    Bottom ctValue           135  47.7  1.53 b                  2    0.31 NA
# 2 BT    Center ctValue           135  40    4.36 b                  2    0.59 NA
# 3 BT    Top    ctValue           135  61.7  7.02 a                  2    0.07 ●
# 4 CK    Bottom ctValue           135  42    7.21 a                  1    0.31 NA
# 5 CK    Center ctValue           135  38.3  2.08 a                  1    0.59 NA
# 6 CK    Top    ctValue           135  46.7  7.57 a                  1    0.07 ●
# 7 BT    Bottom ftValue           135  48    1    b                  2    1    NA
# 8 BT    Center ftValue           135  49.3  8.02 b                  2    0.78 NA
# 9 BT    Top    ftValue           135  77    3.61 a                  2    0.07 ●
# 10 CK    Bottom ftValue           135  48    4.36 a                  1    1    NA
# 11 CK    Center ftValue           135  47.7  5.13 a                  1    0.78 NA
# 12 CK    Top    ftValue           135  53.7 12.3  a                  1    0.07 ●
- 需要注意的是:添加的label也是为了后续筛选掉没有显著性结果做准备。
图a可视化过程
ctValue <- ggplot(
  data = cData1_mean1 %>%
    filter(var_type == "ctValue") %>%
    mutate(Deep = factor(Deep, levels = c("Top", "Center", "Bottom"))),
  aes(x = Type, y = mean, fill = Deep, pattern = Type, width = 0.75)
  ) +

  geom_bar_pattern(
    position = position_dodge(preserve = "single"),
    stat = "identity",
    pattern_fill = "white",
    pattern_color = "white",
    pattern_angle = -50,
    pattern_spacing = 0.05,
    color = "grey",
    width = 0.75
    ) +
  scale_pattern_manual(
    values = c(CK = "stripe", BT = "none")
    ) +

  geom_errorbar(
    data = cData1_mean %>%
      filter(var_type == "ctValue") %>%
      mutate(Deep = factor(Deep, levels = c("Top", "Center", "Bottom"))),
    aes(x = Type, y = mean, ymin = mean - sd, ymax = mean + sd, width = 0.2),
    position = position_dodge(0.75),
    )+

  geom_point(
    data = cData1 %>%
      mutate(Deep = factor(Deep, levels = c("Top", "Center", "Bottom"))),
    aes(x = Type, y = ctValue, group = Deep), color = "black", fill = "#D2D2D2", shape = 21,
    position = position_dodge(0.75), size = 3
    )+

  geom_text(
    data = cData1_mean1 %>%
      filter(var_type == "ctValue",
             label_to_show > 1) %>%
      mutate(Deep = factor(Deep, levels = c("Top", "Center", "Bottom"))),
    aes(x = Type, y = mean + sd, label = groups),
    position = position_dodge(0.75), vjust = -0.5, size = 5
    ) +

  geom_segment(
    data = cData1_summary1 %>%
      filter(p_value <= 0.1 & var_type == "ctValue"),
    aes(x = 0.75, xend = 0.75, y = 73, yend = 76)
  )+
  geom_segment(
    data = cData1_summary1 %>%
      filter(p_value <= 0.1 & var_type == "ctValue"),
    aes(x = 0.75, xend = 1.75, y = 76, yend = 76)
  )+
  geom_segment(
    data = cData1_summary1 %>%
      filter(p_value <= 0.1 & var_type == "ctValue"),
    aes(x = 1.75, xend = 1.75, y = 73, yend = 76)
  )+

  geom_text(
    data = cData1_summary1 %>%
      filter(p_value <= 0.1 & var_type == "ctValue"),
    aes(x = 1.25, y = 76, label = paste0("p = ", p_value)),
    vjust = -0.5, size = 5
    )+

  geom_text(
    data = cData1_summary1 %>%
      filter(p_value <= 0.1 & var_type == "ctValue"),
    aes(x = 1.25, y = 78, label = label),
    vjust = -1, size = 5
  )+

  scale_fill_manual(
    values = c("#393939", "#A2A2A2", "#CCCCCC")
    ) +

  scale_y_continuous(
    expand = c(0, 0), limits = c(0, 100), breaks = seq(0, 100, 50)
    ) +

  theme_classic()+
  theme(
    legend.position = "top",
        axis.ticks.length.y = unit(0.2, "cm"),
        axis.text.y = element_text(color = "black", size = 12),
        axis.title.y = element_text(color = "black", size = 12, face = "bold"),
        axis.title.x = element_blank(),
        axis.text.x = element_blank(),
        axis.line.x = element_blank(),
        axis.ticks.x = element_blank(),
    plot.margin = margin(t = 0, r = 0, b = 1, l = 0, "lines")
    )+
  labs(y = "CTvalue", fill = "", pattern = "");ctValue
图b可视化过程
ftValue <- ggplot(
  data = cData1_mean1 %>%
    filter(var_type == "ftValue") %>%
    mutate(Deep = factor(Deep, levels = c("Top", "Center", "Bottom"))),
  aes(x = Type, y = mean, fill = Deep, pattern = Type, width = 0.75)
) +

  geom_bar_pattern(
    position = position_dodge(preserve = "single"),
    stat = "identity",
    pattern_fill = "white",
    pattern_color = "white",
    pattern_angle = -50,
    pattern_spacing = 0.05,
    color = "grey",
    width = 0.75
  ) +
  scale_pattern_manual(
    values = c(CK = "stripe", BT = "none")
  ) +

  geom_errorbar(
    data = cData1_mean %>%
      filter(var_type == "ftValue") %>%
      mutate(Deep = factor(Deep, levels = c("Top", "Center", "Bottom"))),
    aes(x = Type, y = mean, ymin = mean - sd, ymax = mean + sd, width = 0.2),
    position = position_dodge(0.75),
  )+

  geom_point(
    data = cData1 %>%
      mutate(Deep = factor(Deep, levels = c("Top", "Center", "Bottom"))),
    aes(x = Type, y = ftValue, group = Deep), color = "black", fill = "#D2D2D2", shape = 21,
    position = position_dodge(0.75), size = 3
  )+

  geom_text(
    data = cData1_mean1 %>%
      filter(var_type == "ftValue",
             label_to_show > 1) %>%
      mutate(Deep = factor(Deep, levels = c("Top", "Center", "Bottom"))),
    aes(x = Type, y = mean + sd, label = groups),
    position = position_dodge(0.75), vjust = -0.5, size = 5
  ) +

  geom_segment(
    data = cData1_summary1 %>%
      filter(p_value <= 0.1 & var_type == "ftValue"),
    aes(x = 0.75, xend = 0.75, y = 85, yend = 88)
  )+
  geom_segment(
    data = cData1_summary1 %>%
      filter(p_value <= 0.1 & var_type == "ftValue"),
    aes(x = 0.75, xend = 1.75, y = 88, yend = 88)
  )+
  geom_segment(
    data = cData1_summary1 %>%
      filter(p_value <= 0.1 & var_type == "ftValue"),
    aes(x = 1.75, xend = 1.75, y = 85, yend = 88)
  )+

  geom_text(
    data = cData1_summary1 %>%
      filter(p_value <= 0.1 & var_type == "ftValue"),
    aes(x = 1.25, y = 88, label = paste0("p = ", p_value)),
    vjust = -0.5, size = 5
  )+

  geom_text(
    data = cData1_summary1 %>%
      filter(p_value <= 0.1 & var_type == "ftValue"),
    aes(x = 1.25, y = 90, label = label),
    vjust = -1, size = 5
  )+

  scale_fill_manual(
    values = c("#393939", "#A2A2A2", "#CCCCCC")
  ) +

  scale_y_continuous(
    expand = c(0, 0), limits = c(0, 100), breaks = seq(0, 100, 50)
  ) +

  theme_classic()+
  theme(
    legend.position = "top",
    axis.ticks.length.y = unit(0.2, "cm"),
    axis.text.y = element_text(color = "black", size = 12),
    axis.title.y = element_text(color = "black", size = 12, face = "bold"),
    axis.title.x = element_blank(),
    axis.text.x = element_blank(),
    axis.line.x = element_blank(),
    axis.ticks.x = element_blank()
  )+
  labs(y = "FTvalue", fill = "", pattern = "");ftValue
合并图ab
ggarrange(ctValue, ftValue, nrow = 2, ncol = 1, labels = c ("A", "B"),
          align = "hv", common.legend = T)
复现效果还是比较完美的。中间可视化代码细节比较多,大家可以自行学习,可以留言提问答疑。


