Python:使用matplotlib绘图遇到的多种问题及相应解决方法
文章目录
- 一、全局设置图像字体
- 二、设置图像比例
- 三、绘制缩放图
- 四、图像中需要显示公式或者特殊字符
- 五、图例legend相关设置
- 六、调整图像清晰度及去除白边
- 七、调整线条标记大小及显示间隔
一、全局设置图像字体
在代码开头加入如下代码段:
config = {
    "font.family":'serif', # 衬线字体
    "font.size": 16, #12相当于小四大小
    "mathtext.fontset":'stix', # 数学公式字体,显示效果接近Times new roman
    "font.serif": ['SimSun'], # 中文字体设置为SimSun,相当于宋体
}
rcParams.update(config)
二、设置图像比例
ax.set_aspect(0.8) #设置高宽比
三、绘制缩放图
axins = ax.inset_axes((0.48, 0.08, 0.45, 0.45))#(x0, y0, width, height),确定子图位置

axins.tick_params(labelsize=11)
labels1 = axins.get_xticklabels() + axins.get_yticklabels()
[label.set_fontname('Times New Roman') for label in labels1]

#在缩放图中也绘制主图所有内容,然后根据限制横纵坐标来达成局部显示的目的
axins.plot(FPR1, TPR1, linestyle='-', marker='o', color='red', markersize=5, linewidth=1,markevery=10)
axins.grid(linestyle='--') #设置子图中显示网格

#调整子坐标系的显示范围
axins.set_xlim(0.0, 0.03)
axins.set_ylim(0.65, 1.0)

# 设置子坐标系的显示间隔
x_major_locator1 = MultipleLocator(0.006)# 刻度间隔设置为0.5*pi
axins.xaxis.set_major_locator(x_major_locator1)
y_major_locator1 = MultipleLocator(0.1)
axins.yaxis.set_major_locator(y_major_locator1)

plt.grid(linestyle='--')
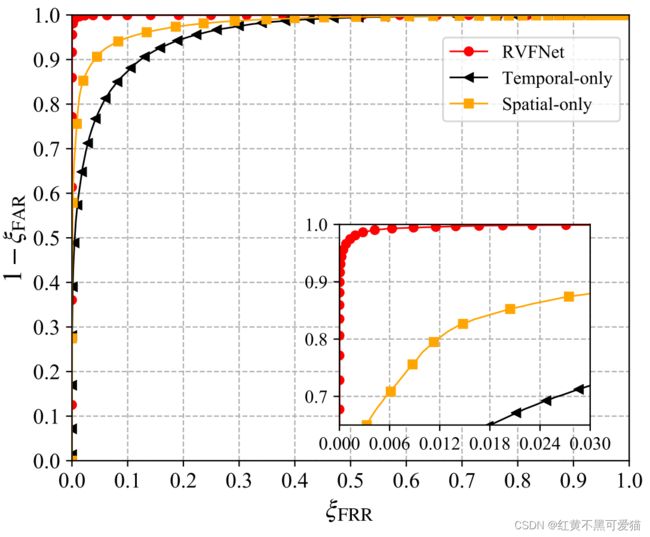
缩放图效果如下(文章接下来的几个代码显示效果都可以参考该图):
四、图像中需要显示公式或者特殊字符
plt.xlabel(r'$\xi_\mathrm{{FRR}}$')
plt.ylabel(r'$1-\xi_{\mathrm{FAR}}$')

#代码解读:$$中写入公式,具体语法格式与latex相似
五、图例legend相关设置
plt.legend(["RVFNet","Temporal-only","Spatial-only"], ncol=1,
           prop={"family": "Times New Roman", "size": 11},bbox_to_anchor=(1,0.97))
ncol为图例的列的数量,prop中可以设置legend的字体及字号,bbox_to_anchor用于设置图例的位置。
六、调整图像清晰度及去除白边
plt.savefig(r'ablation_branch.pdf',bbox_inches='tight', pad_inches=0.0, dpi=900)
dpi设置图片分辨率,值越大越清晰;bbox_inches = ‘tight’ 可以去除坐标轴占用的空间;pad_inches = 0 这句是重点,用于去除所有白边。
七、调整线条标记大小及显示间隔
plt.plot(FPR1, TPR1, linestyle='-', marker='o', color='red', linewidth=1, markersize=5,markevery=30)
linewidth设置线条粗细;markersize 设置标记大小;markevery 设置标记的显示间隔。