《Python数据分析基础教程:NumPy学习指南(第2版)》笔记8:第三章 常用函数4——线性模型、数组修剪与压缩、阶乘
本章将介绍NumPy的常用函数。具体来说,我们将以分析历史股价为例,介绍怎样从文件中载入数据,以及怎样使用NumPy的基本数学和统计分析函数。这里还将学习读写文件的方法,并尝试函数式编程和NumPy线性代数运算。
第三章 常用函数
3.25 线性模型
许多科学研究中都会用到线性关系的模型。NumPy的linalg包是专门用于线性代数计算的。
下面的工作基于一个假设,就是一个价格可以根据N个之前的价格利用线性模型计算得出。
3.26 动手实践:用线性模型预测价格
我们姑且假设,**一个股价可以用之前股价的线性组合表示出来,也就是说,这个股价等于之前的股价与各自的系数相乘后再做加和的结果,这些系数是需要我们来确定的。用线性代数的术语来讲,这就是解一个最小二乘法的问题。**步骤如下。
- (1) 首先,获取一个包含
N个股价的向量b。
import numpy as np

N = 5

c = np.loadtxt('data.csv', delimiter=',', usecols=(6,), unpack=True)

b = c[-N:]
b = b[::-1]
print("b", b)
输出结果如下:
b [ 351.99 346.67 352.47 355.76 355.36]
- (2) 第二步,初始化一个
N×N的二维数组A,元素全部为0。
A = np.zeros((N, N), float)
print("Zeros N by N", A)
输出为:
Zeros N by N [[ 0. 0. 0. 0. 0.]
[ 0. 0. 0. 0. 0.]
[ 0. 0. 0. 0. 0.]
[ 0. 0. 0. 0. 0.]
[ 0. 0. 0. 0. 0.]]
- (3) 第三步,用
b向量中的N个股价值填充数组A。
for i in range(N):
    A[i, ] = c[-N - 1 - i: - 1 - i]

print("A", A)
输出为:
A [[360.   355.36 355.76 352.47 346.67]
 [359.56 360.   355.36 355.76 352.47]
 [352.12 359.56 360.   355.36 355.76]
 [349.31 352.12 359.56 360.   355.36]
 [353.21 349.31 352.12 359.56 360.  ]]
- (4) 我们的目标是确定线性模型中的那些系数,以解决最小平方和的问题。我们使用
linalg包中的lstsq函数来完成这个任务。
(x, residuals, rank, s) = np.linalg.lstsq(A, b)
print(x, residuals, rank, s)
输出结果如下:
[ 0.78111069 -1.44411737 1.63563225 -0.89905126 0.92009049]
[] 5 [ 1.77736601e+03 1.49622969e+01 8.75528492e+00 5.15099261e+00 1.75199608e+00]
返回的元组中包含稍后要用到的系数向量x、一个残差数组、 A的秩以及A的奇异值。
- (5) 一旦得到了线性模型中的系数,我们就可以预测下一次的股价了。使用
NumPy中的dot函数计算系数向量与最近N个价格构成的向量的点积(dot product)。
print(np.dot(b, x))
这个点积就是向量b中那些价格的线性组合,系数由向量x提供。我们得到如下结果:
357.9391610152338
我查了一下记录,下一个交易日实际的收盘价为353.56。因此,我们用N = 5做出的预测结果并没有差得很远。
小结
我们为股价预测建立了一个线性模型,于是这个金融问题就变成了一个线性代数问题。 NumPy中的linalg包里有一个lstsq函数,帮助我们求出了问题的解——即估计线性模型中的系数。在得到解之后,我们将系数应用于NumPy中的dot函数,通过线性回归的方法预测了下一次的股价。
示例完整代码如下:
import numpy as np

N = 5

c = np.loadtxt('data.csv', delimiter=',', usecols=(6,), unpack=True)

b = c[-N:]
b = b[::-1]
print("b", b)

A = np.zeros((N, N), float)
print("Zeros N by N", A)

for i in range(N):
    A[i, ] = c[-N - 1 - i: - 1 - i]

print("A", A)

(x, residuals, rank, s) = np.linalg.lstsq(A, b)
print(x, residuals, rank, s)

print(np.dot(b, x))
3.27 趋势线
趋势线,是根据股价走势图上很多所谓的**枢轴点(Pivot Point)**绘成的曲线。顾名思义,趋势线描绘的是价格变化的趋势。过去的股民们在纸上用手绘制趋势线,而现在我们可以让计算机来帮助我们作图。在这一节的教程中,我们将用非常简易的方法来绘制趋势线,可能在实际生活中不是很奏效,但这应该能将趋势线的原理阐述清楚。
3.28 动手实践:绘制趋势线
按照如下步骤绘制趋势线。
- (1) 首先,我们需要确定枢轴点的位置。这里,我们假设它们等于最高价、最低价和收盘价的算术平均值。
import numpy as np
import matplotlib.pyplot as plt

h, l, c = np.loadtxt('data.csv', delimiter=',', usecols=(4, 5, 6), unpack=True)

pivots = (h + l + c) / 3
print("Pivots", pivots)
从这些枢轴点出发,我们可以推导出所谓的阻力位和支撑位。**阻力位是指股价上升时遇到阻力,在转跌前的最高价格;支撑位是指股价下跌时遇到支撑,在反弹前的最低价格。**需要提醒的是,阻力位和支撑位并非客观存在,它们只是一个估计量。基于这些估计量,我们就可以绘制出阻力位和支撑位的趋势线。我们定义当日股价区间为最高价与最低价之差。
- (2) 定义一个函数用直线
y= at + b来拟合数据,该函数应返回系数a和b。这里需要再次用到linalg包中的lstsq函数。将直线方程重写为y = Ax的形式,其中A = [t 1], x = [a b]。使用ones_like和vstack函数来构造数组A。
def fit_line(t, y):
   A = np.vstack([t, np.ones_like(t)]).T

   return np.linalg.lstsq(A, y)[0]
- (3) 假设支撑位在枢轴点下方一个当日股价区间的位置,而阻力位在枢轴点上方一个当日股价区间的位置,据此拟合支撑位和阻力位的趋势线。
t = np.arange(len(c))
sa, sb = fit_line(t, pivots - (h - l))
ra, rb = fit_line(t, pivots + (h - l))
support = sa * t + sb
resistance = ra * t + rb
- (4) 到这里我们已经获得了绘制趋势线所需要的全部数据。但是,我们最好检查一下有多少个数据点落在支撑位和阻力位之间。显然,如果只有一小部分数据在这两条趋势线之间,这样的设定就没有意义。设置一个判断数据点是否位于趋势线之间的条件,作为
where函数的参数。
condition = (c > support) & (c < resistance)
print "Condition", condition
between_bands = np.where(condition)
以下是根据条件判断的布尔值:
Condition [False False True True True True True False False True False False
False False False True False False False True True True True False False True True
True False True]
复查一下具体取值:
print( support[between_bands])
print( c[between_bands])
print( resistance[between_bands])
注意,where函数返回的是一个秩为2的数组,因此在使用len函数之前需要调用ravel函数。
between_bands = len(np.ravel(between_bands))
print( "Number points between bands", between_bands)
print( "Ratio between bands", float(between_bands)/len(c) )
你将得到如下结果:
Number points between bands 15
Ratio between bands 0.5
我们还得到了一个额外的奖励:一个新的预测模型。我们可以用这个模型来预测下一个交易日的阻力位和支撑位。
print( "Tomorrows support", sa * (t[-1] + 1) + sb)
print( "Tomorrows resistance", ra * (t[-1] + 1) + rb)
输出结果如下:
Tomorrows support 349.389157088
Tomorrows resistance 360.749340996
此外,还有另外一种计算支撑位和阻力位之间数据点个数的方法:使用[]和intersect1d
函数。在[]操作符里面定义选取条件,然后用intersect1d函数计算两者相交的结果。
a1 = c[c > support]
a2 = c[c < resistance]
print( "Number of points between bands 2nd approach" ,len(np.intersect1d(a1, a2)))
如我们所料,得到的结果如下:
Number of points between bands 2nd approach 15
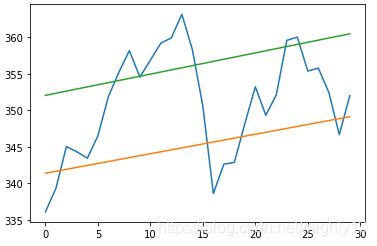
- (5) 我们再次将结果绘制出来,如下所示:
plt.plot(t, c)
plt.plot(t, support)
plt.plot(t, resistance)
plt.show()
绘制结果如下图所示,其中包含了股价数据以及对应的支撑位和阻力位。

小结
我们定义了一个用直线拟合数据的函数,其中用到NumPy中的vstack、 ones_like和lstsq函数。拟合数据是为了得到
支撑位和阻力位两条趋势线的方程。随后,我们用两种不同的方法分别计算了有多少个数据点落在支撑位和阻力位之间的范围内,并得到了一致的结果。
第一种方法使用where函数和一个条件表达式。第二种方法使用[]操作符和intersect1d函数。 intersect1d函数返回一个由两个数组的所有公共元素构成的数组。
示例完整代码如下:
import numpy as np
import matplotlib.pyplot as plt

h, l, c = np.loadtxt('data.csv', delimiter=',', usecols=(4, 5, 6), unpack=True)

pivots = (h + l + c) / 3
print("Pivots", pivots)

def fit_line(t, y):
   A = np.vstack([t, np.ones_like(t)]).T

   return np.linalg.lstsq(A, y)[0]


t = np.arange(len(c))
sa, sb = fit_line(t, pivots - (h - l))
ra, rb = fit_line(t, pivots + (h - l))

support = sa * t + sb
resistance = ra * t + rb
condition = (c > support) & (c < resistance)
print( "Condition", condition)
between_bands = np.where(condition)
print( support[between_bands])
print( c[between_bands])
print( resistance[between_bands])
between_bands = len(np.ravel(between_bands))
print( "Number points between bands", between_bands)
print( "Ratio between bands", float(between_bands)/len(c) )

print( "Tomorrows support", sa * (t[-1] + 1) + sb)
print( "Tomorrows resistance", ra * (t[-1] + 1) + rb)

a1 = c[c > support]
a2 = c[c < resistance]
print( "Number of points between bands 2nd approach" ,len(np.intersect1d(a1, a2)))

plt.plot(t, c)
plt.plot(t, support)
plt.plot(t, resistance)
plt.show()
3.29 ndarray对象的方法
NumPy中的ndarray类定义了许多方法,可以在数组对象上直接调用。通常情况下,这些方法会返回一个数组。你可能已经注意到了,很多NumPy函数都有对应的相同的名字和功能的ndarray对象。这主要是由NumPy发展过程中的历史原因造成的。
ndarray对象的方法相当多,我们无法在这里逐一介绍。前面遇到的var、sum、std、argmax、argmin以及mean函数也均为ndarray方法。
数组的修剪和压缩请参见下一节中的内容。
3.30 动手实践:数组的修剪和压缩
这里给出少量使用ndarray方法的例子。按如下步骤对数组进行修剪和压缩操作。
(1) clip方法返回一个修剪过的数组,也就是将所有比给定最大值还大的元素全部设为给定的最大值,而所有比给定最小值还小的元素全部设为给定的最小值。例如,设定范围1到2对0到4的整数数组进行修剪:
import numpy as np

a = np.arange(5)
print("a =", a)
print("Clipped", a.clip(1, 2))
输出结果如下:
a = [0 1 2 3 4]
Clipped [1 1 2 2 2]
- (2)
compress方法返回一个根据给定条件筛选后的数组。例如:
import numpy as np

a = np.arange(4)
print(a)
print("Compressed", a.compress(a > 2))
输出结果如下:
[0 1 2 3]
Compressed [3]
我们创建了一个0到3的整数数组a,然后调用compress方法并指定条件a > 2,从而获取到
了该数组中的最后一个元素3。
3.31 阶乘
许多程序设计类的书籍都会给出计算阶乘的例子,我们应该保持这个传统。
3.32 动手实践:计算阶乘
ndarray类有一个prod方法,可以计算数组中所有元素的乘积。按如下步骤计算阶乘。
- (1) 计算
8的阶乘。为此,先生成一个1~8的整数数组,并调用prod方法。
import numpy as np

b = np.arange(1, 9)
print("b =", b)
print("Factorial", b.prod())
你可以用计算器检查一下结果是否正确:
b = [1 2 3 4 5 6 7 8]
Factorial 40320
这很不错,但如果我们想知道1~8的所有阶乘值呢?
- (2) 没问题!调用
cumprod方法,计算数组元素的累积乘积。
print("Factorials", b.cumprod())
再次检查一下结果吧:
Factorials [ 1 2 6 24 120 720 5040 40320]