关于横向柱形图的部分自定义样式
梦想总是要有的,万一咸鱼翻身了,我的梦想也能蹦跶几下呢
首先,引用文件就不多说了,完整代码在最下面,我比较懒,简单说一下我遇到的难点问题给自己做记录。
我要做的。
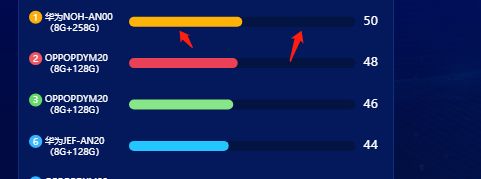
效果图:左边是展示名称的y轴,右边是展示对应数据的y轴。排名前三的样式不同于其他

难点主要在于:
- 1、左侧的名字要在左侧对齐,并且,要添加自定义的排名,前三名的颜色和后面的排名颜色不同
![]()
方案:请注意下面三个箭头位置,改左侧y周的axisLabel,添加自定义样式,右侧的y周原理差不多,不过多描述。

- 2、数据的颜色和原有底色
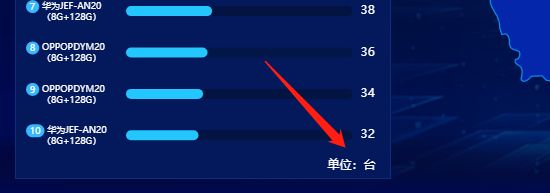
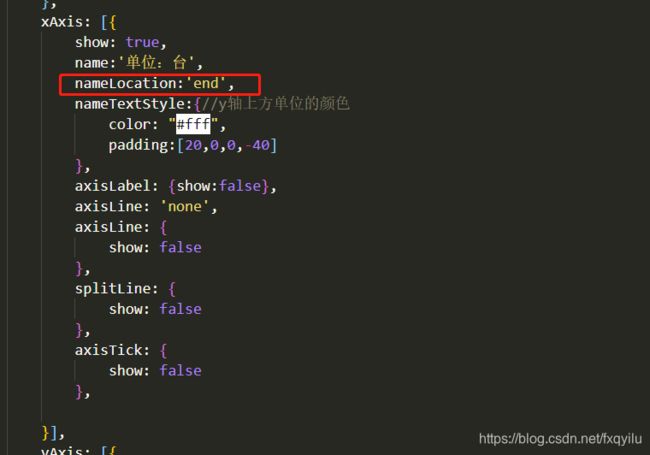
- 3、设置这个标识,哈哈万万没有想到吧,这个是用x轴来代替的,不是y轴自己
放上完整代码
// 横向柱形图

	var dataLine = [50, 48, 46, 44,42, 40, 38, 36,34, 32 ]//左边,右边的数据


    var dataLabel_l = ['华为NOH-AN00(8G+258G)',
     'OPPOPDYM20(8G+128G)',
     'OPPOPDYM20(8G+128G)',
      '华为JEF-AN20(8G+128G)',
      'OPPOPDYM20(8G+128G)',
     'OPPOPDYM20(8G+128G)',
      '华为JEF-AN20(8G+128G)',
      'OPPOPDYM20(8G+128G)',
     'OPPOPDYM20(8G+128G)',
      '华为JEF-AN20(8G+128G)',]
	var dataLabelReverse_l = dataLabel_l.reverse();//左边label的名字(图表是从下往上堆的,如果给的数据想从上往下排,则需要数组翻转)

	var dataLabel_r = ['华为', 'OPPO', 'VIVO', '荣耀','小天才', 'Apple', 'rea-me', '小米', '天翼1号', '涂鸦']
	var dataLabelReverse_r = dataLabel_r.reverse();//左边label的名字(图表是从下往上堆的,如果给的数据想从上往下排,则需要数组翻转)

	chartBarHorizontal('chartBarH_l',dataLine.reverse(),dataLabelReverse_l,100) //dataLine已经倒装
	chartBarHorizontal('chartBarH_r',dataLine,dataLabelReverse_r,70) //dataLine上面已经倒装,不用再次倒装

	function chartBarHorizontal(obj,dataLine,dataLabelReverse,xNumber){
		var chartDom = document.getElementById(obj);
		var myChart = echarts.init(chartDom);

		var myColor = ['#81E7ED']
		var colorList = [
				'#23c6ff','#23c6ff','#23c6ff','#23c6ff','#23c6ff',
				'#23c6ff','#23c6ff','#87e688','#ea4156','#feb30a',
			];	//内柱状图颜色

		var arr = [];
		var option = {
			grid: {
				x: xNumber + 10,
				y: 10,
				y2:20,
			},
			xAxis: [{
				show: true,
				name:'单位:台',
				nameLocation:'end',
				nameTextStyle:{//y轴上方单位的颜色
					color: "#fff",
					padding:[20,0,0,-40]
           		},
				axisLabel: {show:false},
				axisLine: 'none',
				axisLine: {
					show: false
				},
				splitLine: {
					show: false
				},
				axisTick: {
					show: false
				},

			}],
			yAxis: [{
				axisTick: 'none',
				axisLine: 'none',
				// offset: '27',
				axisLabel: {
                    margin: xNumber,
					formatter:function(val,index){
						arr.push(index);
						// arr.reverse()
						if(index==9){
							return '{a|' + 1+ '}'+' ' + val.split("(").join("\n      (");
						}else if(index == 8){
							return '{b|' + 2 + '}' +' ' + val.split("(").join("\n      (");
						}else if(index == 7){
							return '{c|' + 3 + '}' +' ' + val.split("(").join("\n      (");
						}else{
							if(arr[index] == 0){
								arr[index] = 10;
							}
							return '{d|' + arr[index] + '}'+' '  + val.split("(").join("\n      (");
						}
					},
					rich: {
						a: {
							padding:[1,4,3,4],
							borderRadius:20,
                            backgroundColor:'#fbad0b',
                            fontSize: '9',
						},
						b: {
							padding:[1,4,3,4],
							borderRadius:20,
                            backgroundColor: '#ed5762',
                            fontSize: '9',
						},
						c: {
							padding:[1,4,3,4],
							borderRadius:20,
                            backgroundColor: '#67d96a',
                            fontSize: '9',
						},
						d: {
                            padding:[1,4,3,4],
							borderRadius:20,
                            backgroundColor: '#37b7ff',
                            fontSize: '9',
						}
					},
					textStyle: {
						color: '#fff', //y轴字体颜色
						fontSize: '9',
						align:'left'
					}
				},
				data:dataLabelReverse //这个就是翻转过来的数据
			},
			{  //设置柱状图右边参数
				show: true,
				// inverse: true, //表示取值是否倒叙
				data: dataLine,
				axisLabel: {
					formatter:function(val,index){
						if(index==9){
							return '{a|' + val + '}';
						}else if(index == 8){
							return '{b|' + val+ '}';
						}else if(index == 7){
							return '{c|' + val+ '}';
						}else{
							return '{d|' + val + '}';
						}

					},
					rich: {
						a: {
							color: '#fbad0b',
						},
						b: {
							color: '#ed5762',
						},
						c: {
							color: '#67d96a',
						}
					},
					textStyle: {
						color: '#ffffff',
					}
				},
				axisLine: {
					show: false
				},
				splitLine: {
					show: false
				},
				axisTick: {
					show: false
				},
			}],
			series: [
			{
				type: 'bar',
				yAxisIndex: 0,
				data: dataLine,
				barWidth: 10,
				itemStyle: {
					normal: {
						color: function(params) {
							return colorList[params.dataIndex]
						},
						// color: '#37b7ff',
						barBorderRadius:[100, 100, 100, 100],
					}
				},
				z: 2
			},
			{ //背景灰框
				name: '白框',
				type: 'bar',
				yAxisIndex: 1, //必须要设置,使得两个柱子重合,值小的在上面
				data: [99.9, 99.9, 99.9, 99.9,99.9, 99.9, 99.9, 99.9,99.9, 99.9],
				barWidth: 10,
				itemStyle: {
					normal: {
						color: '#031442',
						barBorderRadius:[100, 100, 100, 100],
					},

				},
				z: 1  // 设置维度越高这表示覆盖低的 ,必填!!
			},
			]
		}
		option && myChart.setOption(option);

	}


