学习在echarts中优化数据视图dataView样式 带表格样式
toolbox里有个dataView视图模式,里面的数据没有对整,影响展示效果,情形如下:
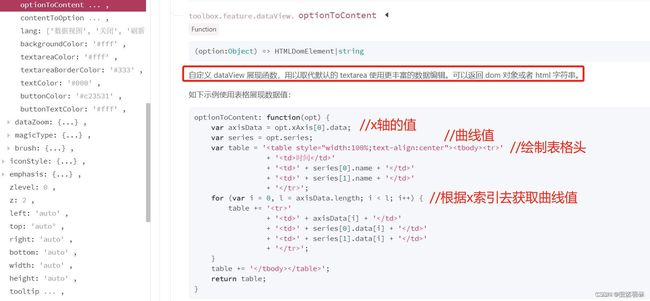
改问题解决方案为,option 》 toolbox 》 feature 》 dataView 》optionTocontent 回调函数中处理,具体代码如下:
option = {
color : [ '#f54c49' , '#1976d2' ] ,
tooltip : {
trigger : 'axis' ,
axisPointer : {
type : 'shadow'
}
} ,
toolbox : {
show : true ,
feature : {
dataView : { show : true , readOnly : false ,
optionToContent : function ( opt ) {
var axisData = opt. xAxis[ 0 ] . data;
var series = opt. series;
var tdHeads = ' 名称 ';
series. forEach ( function ( item ) {
tdHeads += ' '+ item. name+ ' ';
} ) ;
var table = ''+ tdHeads+ ' ';
var tdBodys = '' ;
for ( var i = 0 , l = axisData. length; i < l; i++ ) {
for ( var j = 0 ; j < series. length; j++ ) {
if ( typeof ( series[ j] . data[ i] ) == 'object' ) {
tdBodys += ' '+ series[ j] . data[ i] . value+ ' ';
} else {
tdBodys += ' '+ series[ j] . data[ i] + ' ';
}
}
table += ''+ axisData[ i] + ' '+ tdBodys + ' ;
tdBodys = '' ;
}
table += '
' ;
return table;
}
} ,
magicType : { show : true , type : [ 'line' , 'bar' ] } ,
restore : { show : true } ,
saveAsImage : { show : true }
} ,
iconStyle : {
borderColor : 'white'
}
} }
修改后的效果为:
var table = ''
主要是这个user-select: text; 就能复制了
result = {
"title" : {
"text" : "互动情况(UV)" ,
"subtext" : "注: 点击下方说明项可选择是否展示, UV计算方式: 各个行为对应用户总数(去重)" ,
"textStyle" : {
"color" : "rgba(255, 0, 0, 1)" ,
"fontSize" : 20
}
} ,
"tooltip" : {
"trigger" : "axis" ,
"formatter" : function ( params ) {
let str = '' ;
params. forEach ( ( item, idx ) => {
str += ` ${ item. marker} ${ item. data. time} _ ${ item. seriesName} : ${ item. data. value} ` += idx === params. length - 1 ? '' : '
} )
return str
} ,
} ,
"legend" : {
"type" : "scroll" ,
"bottom" : 6 ,
"data" : [
"like" ,
"comment" ,
"collect" ,
"share" ,
"dislike" ,
"ALL"
]
} ,
"toolbox" : {
"show" : true ,
"feature" : {
"dataZoom" : {
"yAxisIndex" : "none"
} ,
"dataView" : {
"show" : true ,
"optionToContent" : function ( opt ) {
var axisData = opt. xAxis[ 0 ] . data;
var series = opt. series;
console. log ( "1" )
console. log ( series)
console. log ( "2" )
var tdHeads = ` 日期 ` ;
var tdBodys = "" ;
series. forEach ( function ( item ) {
tdHeads += ` ${ item. name} ` ;
} ) ;
var table = ` ${ tdHeads} ` ;
for ( var i = 0 , l = axisData. length; i < l; i++ ) {
for ( var j = 0 ; j < series. length; j++ ) {
if ( series[ j] . data[ i] == undefined ) {
tdBodys += ` ${ "-" } ` ;
} else {
tdBodys += ` ${ series[ j] . data[ i] [ "value" ] } ` ;
}
}
table += ` ${ axisData[ i] } ${ tdBodys} ` ;
tdBodys = "" ;
}
table += "
";
return table;
} ,
"contentToOption" : function ( HTMLDomElement, opt ) {
return opt;
} ,
"readOnly" : false
} ,
"magicType" : {
"type" : [
"line" ,
"bar"
]
} ,
"restore" : {
} ,
"saveAsImage" : {
}
}
} ,
"xAxis" : {
"type" : "category" ,
"boundaryGap" : false ,
"data" : config. xAxis_data,
} ,
"yAxis" : {
"type" : "value" ,
"axisLabel" : {
"formatter" : "{value}"
}
} ,
"series" : [
{
"name" : "like" ,
"type" : "line" ,
"data" : config. interaction_data. like
} ,
{
"name" : "comment" ,
"type" : "line" ,
"data" : config. interaction_data. comment
} ,
{
"name" : "collect" ,
"type" : "line" ,
"data" : config. interaction_data. collect
} ,
{
"name" : "share" ,
"type" : "line" ,
"data" : config. interaction_data. share
} ,
{
"name" : "dislike" ,
"type" : "line" ,
"data" : config. interaction_data. dislike
} ,
{
"name" : "ALL" ,
"type" : "line" ,
"data" : config. interaction_data. ALL
} ,
]
}
return result
你可能感兴趣的:(Echarts,学习,echarts,javascript)
第9天 | openGauss中一个表空间可以存储多个数据库
yBmZlQzJ
openGauss 数据库 oracle postgresql opengauss
接着昨天继续学习openGauss,今天是第9天了。今天学习内容是o一个数据库可以存储在多个表空间中。老规矩,先登陆墨天轮为我准备的实训实验室root@modb:~#su-ommomm@modb:~$gsql-r作业要求1.创建表空间newtbs1omm=#CREATETABLESPACEnewtbs1RELATIVELOCATION'tablespace/tablespace_1';CREATE
【有没有快速好记的方法记全五十音啊】
日语自学达人
1、学习日语的开始是学五十个音节。大多数学生不太熟悉五十音图。所谓五十音图相当于在我们的汉语拼音字母表中,记忆五十音图是学习日语的前提。因此,学生在学习和训练50音图的过程中不能放松。如果你想能够流利地背诵50音图,我将带大家详细了解什么是50音图!2.学会五十音图尽可能早地实现日语快速入门1.清音:日本学生发音过程中声带振动的是清音,又称“浊音”;不振动的浊音是浊音,又称“非浊音”。3、日语中的
《[系统底层攻坚] 张冬〈大话存储终极版〉精读计划启动——存储架构原理深度拆解之旅》-系统性学习笔记(适合小白与IT工作人员)
谢郎Kobe
大活存储 学习 架构 云计算 硬件架构 大数据
致所有存储技术探索者笔者近期将系统攻克存储领域经典巨作——张冬老师编著的《大话存储终极版》。这部近千页的存储系统圣经,以庖丁解牛的方式剖析了:存储硬件底层架构、分布式存储核心算法、超融合系统设计哲学等等。喜欢研究数据存储或者工作应用到存储的小伙伴,可以学习这本书。如果想利用碎片时间学习,也可以持续关注一下笔者不定期的章节解析。现在本人将此书的目录结构整理如下,未来笔者将按照顺序不定期更新【学习笔记
【机器学习】必会降维算法之:独立成分分析(ICA)
Carl_奕然
机器学习 算法 人工智能
独立成分分析(ICA)1、引言2、独立成分分析(ICA)2.0引言2.1定义2.2应用场景2.3核心原理2.4实现方式2.5算法公式2.6代码示例3、总结1、引言小屌丝:鱼哥,最近胡塞武装很哇塞啊。小鱼:你什么时候开始关注军事了?小屌丝:这…还用关注吗?都上新闻了。小鱼:嗯,那你知道胡塞武装为什么这么厉害吗?小屌丝:额…当然是光脚不怕穿鞋的。小鱼:…你可真是…小屌丝:真是啥?小鱼:一个字,自己体会
2023-5-18晨间日记
仓鼠zhi轮_2
今天是坚守日子起床:5:35就寝:23:30天气:多云心情:还行纪念日:假如爱有天意任务清单昨日完成的任务,最重要的三件事:一是八段锦完成一遍,二是完成一遍英语,三是组织会场改进:成立好习惯督导群习惯养成:抓紧做应该做的事情周目标·完成进度:解决难题学习·信息·阅读:宁静致远健康·饮食·锻炼:坚持就是胜利人际·家人·朋友:忙中突进工作·思考:稳住最美好的三件事:1.八段锦2.做饭送餐3.睡觉思考·
21天趁早手账学习之旅
Sugar_沫沫
结缘趁早,是因为朋友推荐使用趁早日程记录本,18年入手后,只是作为日程安排的记录,还有重点工作的梳理和记录。新的一年目标中有一个是要完成Eva老师视觉基础课程,学习和实践视觉记录。无意中看到了趁早发起的活动内容,觉得很有助于新年视觉学习的目标,带着好奇和怀疑报名了(怀疑自己可能无法打满卡,再之后就满怀期待的等着开营,把这作为新年第一个Flag。一晃眼,21天过去了,与其他小伙伴们一起坚持学习和打卡
IDP-L5-学习心得
swag_ae02
进入进阶课,我们的好朋友林菠萝也开启了职业生涯的新的阶段。在回顾她的成长经历时,她有一句话让我印象特别深刻,“我要给工作赋予意义。”而在这当中牵扯到的一个概念就是内驱目标。与之相对应的就是外驱目标。自我决定理论当中提到过我们做一件事情是因为我们自己想做,而不是被迫或者受到强迫而不得不做。因为我们想,我们就会有更强的目标认同感,更敏捷的行动,这样,我们才能实现真正的改变。当我们突然收到上级的紧急任务
学习婚姻法笔记
韩哲2018
本文一共1967字预计阅读4分钟婚姻法很有必要学习这篇文章可以拉男朋友女朋友丈夫老婆一起大大方方的学习本篇文章是学习得到里面余婧老师《如何用法律智慧为婚姻护航?》课程笔记比较精简想要详细学习可以得到里面学习。恋爱期间无目的赠送的价格昂贵的东西分手后是无法要回的即无条件赠与以结婚为目的性的赠送是可以要回的即附解除条件的赠与第一需要证明你的确把东西赠送出去了第二证明送东西是以结婚为目的的需要相关的人证
那天,他从微光中走来,如同神明,背着光,高高在上,冷眼俯视着跪在黑暗里瑟瑟发抖的我。
1fa206cf3146
1我在楼梯道遇见江悦的时候,外面的天已经黑了。「哟,出来了?」昏暗的楼道里,江悦艳红的唇特别显眼,她不耐烦的扔掉手指间夹着的烟头。江悦身后的那群女生慢慢的朝我围过来。我不禁向后退了几步,不详的预感逐渐笼上心头。「江悦,你等我干什么?」我听见自己的声音断断续续的颤抖。「怎么?这么快就忘记你之前干的事了?」我被抓到江悦的面前。我的大脑开始飞速回想,坐在座位上学习一天的我,到底做了什么,会引起江悦这位大
2021/3/16 星期二 晴
40b358b2b093
下午和哥哥两个去了新房那边准备安装电灯和开关面板了,对我这个一窍不通的来说有点难度,只能怪学习没有好好学罢了,我负责做一些简单的东西,打打下手似乎也快了不少,安装了一会放上电试一下,这可麻烦了总闸直接跳了,没有办法跑去负二层把总的电闸通上,还是不行可能那里出了问题,导致整栋楼都没有电了,哥哥检修了一会终于好了,忙活了一下午连一半都没有做完,皓轩放学时间也到了,今下午去的有点迟,小家伙来来回回走了好
2021年道路运输企业主要负责人和安全生产管理人员安全考核题型二[安考星]
安考星
第二部分:道路运输企业安全生产管理人员安全考核模拟学习试题该模拟题库适用于全国道路运输企业安全生产管理人员模拟考试通用部分,了解更多工种完整题库信息,百度搜索【安考星】或关注“安考星”微信公众号,支持电脑及手机多端同步练习。一、单选题题干:在公交车行驶过程中,乘客王某因与驾驶员发生矛盾,遂殴打驾驶员并抢夺方向盘,造成其他乘客受轻微伤,依照《中华人民共和国刑法》的规定,王某触犯了()罪。A、以危险方
Java 大视界 -- Java 大数据机器学习模型在金融市场情绪分析与投资策略制定中的应用
青云交
大数据新视界 Java 大视界 java 大数据 机器学习 情绪分析 智能投资 多源数据
Java大视界--Java大数据机器学习模型在金融市场情绪分析与投资策略制定中的应用)引言:正文:一、金融情绪数据的立体化采集与治理1.1多模态数据采集架构1.2数据治理与特征工程二、Java机器学习模型的工程化实践2.1情感分析模型的深度优化2.2强化学习驱动的动态投资策略三、顶级机构实战:Java系统的金融炼金术四、技术前沿:Java与金融科技的未来融合4.1量子机器学习集成4.2联邦学习在合
TensorFlow深度学习实战——DCGAN详解与实现
盼小辉丶
深度学习 tensorflow 生成对抗网络
TensorFlow深度学习实战——DCGAN详解与实现0.前言1.DCGAN架构2.构建DCGAN生成手写数字图像2.1生成器与判别器架构2.2构建DCGAN相关链接0.前言深度卷积生成对抗网络(DeepConvolutionalGenerativeAdversarialNetwork,DCGAN)是一种基于生成对抗网络(GenerativeAdversarialNetwork,GAN)的深度学
Python,Java,C++开发磁悬浮原理与技术实操APP
Geeker-2025
python java c++
#磁悬浮原理与技术实操APP技术方案基于Python、Java和C++开发的磁悬浮原理学习与应用APP,结合理论教学与实操模拟:##系统架构设计```mermaidgraphTDA[跨平台客户端-C++/Qt]-->|API调用|B[后端服务-Java/Spring]B-->C[磁悬浮模拟引擎-Python]B-->D[硬件控制接口]C-->E[物理模型计算]D-->F[磁悬浮套件]A-->G[3
今天还有感赏和投射
静定稳慧
在我接触到正能量磁场教育后,我自己心态好了很多,儿子情绪也真的有好转。我非常惊喜。昨晚他突然说到暑假完上学的事又突然情绪急躁脾气失控。我也不知道怎么说才能让他平静下来。感赏他后来静下来了。感赏他今天上午也一直挺好。感赏我今天学习了不少,情绪也挺正投射他今天继续情绪平稳投射他能锻练一下身体投射我继续保持正能量磁场感赏儿子
青少年必读之积累
a许海燕
图片发自App孩子们好,今天我们跟着陆惠萍老师一起学习两个字--积累,那我们其实在幼儿园有幼儿园的积累,小学有小学的积累,然后初中有初中的积累,那如果你是小学毕业生,你一开口讲话,人家一想一听,哦小学生,因为你的积累,自然会呈现出来嘛。就是你讲的话一定是来暴露你的,你的穿着啊打扮啊你的表情啊,你讲话的这些内容,都在表达你有多少积累在那边,所以有时候我们也做一些决定,但是这些决定其实都是片面的,为什
JavaScript 异步编程的终极指南:从回调到 Promise、Async/Await
JavaScript异步编程的终极指南:从回调到Promise、Async/Await你是否也曾被一个涉及多层网络请求的函数折磨得死去活来?代码像俄罗斯套娃一样层层嵌套,逻辑混乱不堪,bug隐藏在深渊之中。这种场景,就是每个JavaScript开发者都无法回避的课题:异步编程。由于JavaScript运行在单线程环境中,异步是其命脉所在。它允许程序在等待耗时操作(如API请求、文件读写)完成时,继
c语言学习15四则运算
四则运算练习需求:进入一个界面选择+-*/printf选择运算法则(如果选择错误,提示重新选择)switchcasedefult显示100以内两个随机数,输入运算结果rand系统显示正确答案,并且判断正确错误要求:封装函数分析:intmain(void){//界面程序-----界面函数//输入和识别程序-----按键识别函数//随机数程序----产生随机数函数//系统计算并且对比答案----对比答
从零开始学习 Redux:React Native 项目中的状态管理
wayne214
react native 学习 react.js
Redux是一个用于JavaScript应用程序的状态管理库,通常与React或ReactNative配合使用,帮助管理应用的状态和数据流。其核心原理是通过集中式的“单一数据源”来管理应用状态,避免组件之间的“层层传递”状态和副作用。Redux的原理单一数据源(Store)Redux维护一个全局状态树(即Store),所有组件都通过读取这个状态树来获取数据。应用中的所有状态(数据)都存储在这个单一
音频学习8.27
DZ2015
经营自己的弱连接系统,有4个关键字:专长、分享、接触与反馈。第一一定要去找到一个你的专长,如果你现在没有,那就慢慢去培养它。第二,要不断的去分享,越大规模的分享越有价值。第三,在分享的过程当中,不仅仅要注重自己的输出,更重要的是,要与更多的伙伴进行有效的互动与接触。第四,你要从大家的身上不断地去获得反馈,成为你成长的动力。
开学第一天
月城风
我叫程樱,一个出生在南方的姑娘,从小爸爸妈妈教育我要努力学习才能出路,所以从小到大我都是别人口中的“别人家的孩子”。我也很享受这种被夸赞的感觉,所以我拼了命去学习,学习一直都是名列前茅,初三时我以全级第一名的成绩进入到市重点高中。我很期待我的高中生活,中考结束后,我和我的闺蜜赵雯彻夜未眠,因为太兴奋了,终于要结束初中生活,再过三年高中,我们就可以去到那个向往的大学。这年的夏天格外的炎热,坐在院子里
安装python后如何安装numpy_如何简单安装NumPy与SciPy
2015-12-27回答numpy是一个定义了数值数组和矩阵类型和它们的基本运算的语言扩展。scipy是一种使用numpy来做高等数学、信号处理、优化、统计和许多其它科学任务的语言扩展。学习这两个工具的话,官方有很详细的文档和教程来帮助入门:我是传送门另外,还有一本书《numpyandscipy》,很薄,才67页:我是传送门如何安装numpy和scipy之所以写这篇文章主要是因为scipy官网貌似
书读一半,课上几节,蓄力明天再战!
Joey琳爱读书
先打预防针,我今天又要水文了。先说上课,相比现在的学习状态和精气神,我知道,之前的几节课是水过去了。网课上到23点。之前要是晚上听课,脑子容易稀里糊涂的,而且不就就想睡觉。今天倒是清醒得很,一个手机,一本原题;一个人的房间,一节课的时间。明明白白地过来了,果真有学习方法就是不一样,效率提升不少。(不过知识付费贵,特别羡慕自学就能行的人)。今天晚上是休战了,写到这里已经23:31了。明天继续努力,学
2021-4-8晨间日记
陈慧Vicky
落地北京起床:去办理一些乱七八糟使人头疼的事宜就寝:希望快些回到我的大银川,年龄越大越不想出门。哦,不,好像和年龄没有关系,一直喜欢甘于现状天气:有一点点凉心情:很复杂/无法形容纪念日:任务清单未有改进:甘于现状周目标·完成进度学习·信息·阅读健康·饮食·锻炼人际·家人·朋友工作·思考最美好的三件事1.2.3.思考·创意·未来
【机器学习【9】】评估算法:数据集划分与算法泛化能力评估
roman_日积跬步-终至千里
# 机器学习 机器学习
文章目录一、数据集划分:训练集与评估集二、K折交叉验证:提升评估可靠性1.基本原理1.1.K折交叉验证基本原理1.2.逻辑回归算法与L22.基于K折交叉验证L2算法三、弃一交叉验证(Leave-One-Out)1、基本原理2、代码实现四、ShuffleSplit交叉验证1、基本原理2、为什么能降低方差3、代码测试五、选择建议在机器学习中,评估算法的核心目标是衡量模型在“未知数据”上的表现,而不是仅
被动的学习
乐婷0809
2019.3.6星期三雨读经人员:艳红雨乐宇婷诗经时间第514天读经内容:《黄帝内经》《唐诗三百首》《诗经》《新概念英语》保险这个词语对我很敏感,因为我只买了乡镇医疗险,其它保险真没有想买的意思,也一点都不懂得。下午老公的婶婶又叫我去听了一堂关于怎样去推销产品和发展人员的课,真的要睡着了,一点不明白。就在去年我上班都总要我去,今年不上班越总是说,对于在做保险这份工作的人,他们就说是在帮助一个家庭。
过年,我损失了什么?
张超_75c3
自阴历12月28日至正月5日,春节放假在老家待了整整8天。可以这么说,在家过了一个轻轻松松、愉快祥和地春节,晚上打牌、早上睡到10点起床、带妻子和女儿短途旅行两次、串亲戚等等,有说有笑,不亦乐乎!可是,今天我不想说这些,而是更想说说,这八天时间,我到底失去了什么?能不能过的更有意义些?我失去了什么?只有我自己知道,平时的我每天5:20起床,起床后学习“得到”专栏吴军的“谷歌方法论”,每天一篇,可以
【vue-7】Vue3 响应式数据声明:深入理解 reactive()
AllenBright
# Vue vue.js 前端 javascript
在Vue3中,响应式系统经过了彻底的重构,提供了更强大、更灵活的方式来声明和管理响应式数据。reactive()是Vue3组合式API中最核心的响应式函数之一。本文将深入探讨reactive()的工作原理、使用场景以及最佳实践。1.什么是reactive()?reactive()是Vue3提供的一个函数,它接收一个普通JavaScript对象,并返回该对象的响应式代理。这个代理对象与原始对象看起来
在恋爱中学习爱情
坚冰至_Monsol
苏州2018大雪实践出真知,是颠扑不破的真理。推而广之,在战争中学习战争,在水里学会游泳。光说不练,不仅是假把式,还是禁锢自己勇气、纯真、希望的牢笼。同样,在恋爱中学会爱情。每一次用心的“练习”,不仅给自己一生的感情之路,点缀上闪烁晶莹光泽的“小幸运”,还可能得遇相守一生的真幸运。苏州寒山寺甲·认准你要什么马云的“终极三问”,在感情里同样适用:你有什么?你要什么?你能放弃什么?人,不能贪心,不能什
对“人格障碍”的浅认识
春暖花开LittleHui
“人格障碍”这个词是我在学习心理学时接触到的。人格障碍是指明显偏离正常且根深蒂固的行为方式,具有适应不良的性质,其人格在内容上、质上或整个人格方面异常,由于这个原因,病人遭受痛苦,或给个人或社会带来不良影响。人格的异常妨碍了他们的情感和意志活动,破坏了其行为的目的性和统一性,给人以与众不同的特意感觉,在待人接物方面表现尤为突出。人格障碍通常开始于童年、青少年或成年早期,(更多是原生家庭造成的,来自
Js函数返回值
_wy_
js return
一、返回控制与函数结果,语法为:return 表达式;作用: 结束函数执行,返回调用函数,而且把表达式的值作为函数的结果 二、返回控制语法为:return;作用: 结束函数执行,返回调用函数,而且把undefined作为函数的结果 在大多数情况下,为事件处理函数返回false,可以防止默认的事件行为.例如,默认情况下点击一个<a>元素,页面会跳转到该元素href属性
MySQL 的 char 与 varchar
bylijinnan
mysql
今天发现,create table 时,MySQL 4.1有时会把 char 自动转换成 varchar
测试举例:
CREATE TABLE `varcharLessThan4` (
`lastName` varchar(3)
) ;
mysql> desc varcharLessThan4;
+----------+---------+------+-
Quartz——TriggerListener和JobListener
eksliang
TriggerListener JobListener quartz
转载请出自出处:http://eksliang.iteye.com/blog/2208624 一.概述
listener是一个监听器对象,用于监听scheduler中发生的事件,然后执行相应的操作;你可能已经猜到了,TriggerListeners接受与trigger相关的事件,JobListeners接受与jobs相关的事件。
二.JobListener监听器
j
oracle层次查询
18289753290
oracle;层次查询;树查询
.oracle层次查询(connect by)
oracle的emp表中包含了一列mgr指出谁是雇员的经理,由于经理也是雇员,所以经理的信息也存储在emp表中。这样emp表就是一个自引用表,表中的mgr列是一个自引用列,它指向emp表中的empno列,mgr表示一个员工的管理者,
select empno,mgr,ename,sal from e
通过反射把map中的属性赋值到实体类bean对象中
酷的飞上天空
javaee 泛型 类型转换
使用过struts2后感觉最方便的就是这个框架能自动把表单的参数赋值到action里面的对象中
但现在主要使用Spring框架的MVC,虽然也有@ModelAttribute可以使用但是明显感觉不方便。
好吧,那就自己再造一个轮子吧。
原理都知道,就是利用反射进行字段的赋值,下面贴代码
主要类如下:
import java.lang.reflect.Field;
imp
SAP HANA数据存储:传统硬盘的瓶颈问题
蓝儿唯美
HANA
SAPHANA平台有各种各样的应用场景,这也意味着客户的实施方法有许多种选择,关键是如何挑选最适合他们需求的实施方案。
在 《Implementing SAP HANA》这本书中,介绍了SAP平台在现实场景中的运作原理,并给出了实施建议和成功案例供参考。本系列文章节选自《Implementing SAP HANA》,介绍了行存储和列存储的各自特点,以及SAP HANA的数据存储方式如何提升空间压
Java Socket 多线程实现文件传输
随便小屋
java socket
高级操作系统作业,让用Socket实现文件传输,有些代码也是在网上找的,写的不好,如果大家能用就用上。
客户端类:
package edu.logic.client;
import java.io.BufferedInputStream;
import java.io.Buffered
java初学者路径
aijuans
java
学习Java有没有什么捷径?要想学好Java,首先要知道Java的大致分类。自从Sun推出Java以来,就力图使之无所不包,所以Java发展到现在,按应用来分主要分为三大块:J2SE,J2ME和J2EE,这也就是Sun ONE(Open Net Environment)体系。J2SE就是Java2的标准版,主要用于桌面应用软件的编程;J2ME主要应用于嵌入是系统开发,如手机和PDA的编程;J2EE
APP推广
aoyouzi
APP 推广
一,免费篇
1,APP推荐类网站自主推荐
最美应用、酷安网、DEMO8、木蚂蚁发现频道等,如果产品独特新颖,还能获取最美应用的评测推荐。PS:推荐简单。只要产品有趣好玩,用户会自主分享传播。例如足迹APP在最美应用推荐一次,几天用户暴增将服务器击垮。
2,各大应用商店首发合作
老实盯着排期,多给应用市场官方负责人献殷勤。
3,论坛贴吧推广
百度知道,百度贴吧,猫扑论坛,天涯社区,豆瓣(
JSP转发与重定向
百合不是茶
jsp servlet Java Web jsp转发
在servlet和jsp中我们经常需要请求,这时就需要用到转发和重定向;
转发包括;forward和include
例子;forwrad转发; 将请求装法给reg.html页面
关键代码;
req.getRequestDispatcher("reg.html
web.xml之jsp-config
bijian1013
java web.xml servlet jsp-config
1.作用:主要用于设定JSP页面的相关配置。
2.常见定义:
<jsp-config>
<taglib>
<taglib-uri>URI(定义TLD文件的URI,JSP页面的tablib命令可以经由此URI获取到TLD文件)</tablib-uri>
<taglib-location>
TLD文件所在的位置
JSF2.2 ViewScoped Using CDI
sunjing
CDI JSF 2.2 ViewScoped
JSF 2.0 introduced annotation @ViewScoped; A bean annotated with this scope maintained its state as long as the user stays on the same view(reloads or navigation - no intervening views). One problem w
【分布式数据一致性二】Zookeeper数据读写一致性
bit1129
zookeeper
很多文档说Zookeeper是强一致性保证,事实不然。关于一致性模型请参考http://bit1129.iteye.com/blog/2155336
Zookeeper的数据同步协议
Zookeeper采用称为Quorum Based Protocol的数据同步协议。假如Zookeeper集群有N台Zookeeper服务器(N通常取奇数,3台能够满足数据可靠性同时
Java开发笔记
白糖_
java开发
1、Map<key,value>的remove方法只能识别相同类型的key值
Map<Integer,String> map = new HashMap<Integer,String>();
map.put(1,"a");
map.put(2,"b");
map.put(3,"c"
图片黑色阴影
bozch
图片
.event{ padding:0; width:460px; min-width: 460px; border:0px solid #e4e4e4; height: 350px; min-heig
编程之美-饮料供货-动态规划
bylijinnan
动态规划
import java.util.Arrays;
import java.util.Random;
public class BeverageSupply {
/**
* 编程之美 饮料供货
* 设Opt(V’,i)表示从i到n-1种饮料中,总容量为V’的方案中,满意度之和的最大值。
* 那么递归式就应该是:Opt(V’,i)=max{ k * Hi+Op
ajax大参数(大数据)提交性能分析
chenbowen00
Web Ajax 框架 浏览器 prototype
近期在项目中发现如下一个问题
项目中有个提交现场事件的功能,该功能主要是在web客户端保存现场数据(主要有截屏,终端日志等信息)然后提交到服务器上方便我们分析定位问题。客户在使用该功能的过程中反应点击提交后反应很慢,大概要等10到20秒的时间浏览器才能操作,期间页面不响应事件。
根据客户描述分析了下的代码流程,很简单,主要通过OCX控件截屏,在将前端的日志等文件使用OCX控件打包,在将之转换为
[宇宙与天文]在太空采矿,在太空建造
comsci
我们在太空进行工业活动...但是不太可能把太空工业产品又运回到地面上进行加工,而一般是在哪里开采,就在哪里加工,太空的微重力环境,可能会使我们的工业产品的制造尺度非常巨大....
地球上制造的最大工业机器是超级油轮和航空母舰,再大些就会遇到困难了,但是在空间船坞中,制造的最大工业机器,可能就没
ORACLE中CONSTRAINT的四对属性
daizj
oracle CONSTRAINT
ORACLE中CONSTRAINT的四对属性
summary:在data migrate时,某些表的约束总是困扰着我们,让我们的migratet举步维艰,如何利用约束本身的属性来处理这些问题呢?本文详细介绍了约束的四对属性: Deferrable/not deferrable, Deferred/immediate, enalbe/disable, validate/novalidate,以及如
Gradle入门教程
dengkane
gradle
一、寻找gradle的历程
一开始的时候,我们只有一个工程,所有要用到的jar包都放到工程目录下面,时间长了,工程越来越大,使用到的jar包也越来越多,难以理解jar之间的依赖关系。再后来我们把旧的工程拆分到不同的工程里,靠ide来管理工程之间的依赖关系,各工程下的jar包依赖是杂乱的。一段时间后,我们发现用ide来管理项程很不方便,比如不方便脱离ide自动构建,于是我们写自己的ant脚本。再后
C语言简单循环示例
dcj3sjt126com
c
# include <stdio.h>
int main(void)
{
int i;
int count = 0;
int sum = 0;
float avg;
for (i=1; i<=100; i++)
{
if (i%2==0)
{
count++;
sum += i;
}
}
avg
presentModalViewController 的动画效果
dcj3sjt126com
controller
系统自带(四种效果):
presentModalViewController模态的动画效果设置:
[cpp]
view plain
copy
UIViewController *detailViewController = [[UIViewController al
java 二分查找
shuizhaosi888
二分查找 java二分查找
需求:在排好顺序的一串数字中,找到数字T
一般解法:从左到右扫描数据,其运行花费线性时间O(N)。然而这个算法并没有用到该表已经排序的事实。
/**
*
* @param array
* 顺序数组
* @param t
* 要查找对象
* @return
*/
public stati
Spring Security(07)——缓存UserDetails
234390216
ehcache 缓存 Spring Security
Spring Security提供了一个实现了可以缓存UserDetails的UserDetailsService实现类,CachingUserDetailsService。该类的构造接收一个用于真正加载UserDetails的UserDetailsService实现类。当需要加载UserDetails时,其首先会从缓存中获取,如果缓存中没
Dozer 深层次复制
jayluns
VO maven po
最近在做项目上遇到了一些小问题,因为架构在做设计的时候web前段展示用到了vo层,而在后台进行与数据库层操作的时候用到的是Po层。这样在业务层返回vo到控制层,每一次都需要从po-->转化到vo层,用到BeanUtils.copyProperties(source, target)只能复制简单的属性,因为实体类都配置了hibernate那些关联关系,所以它满足不了现在的需求,但后发现还有个很
CSS规范整理(摘自懒人图库)
a409435341
html UI css 浏览器
刚没事闲着在网上瞎逛,找了一篇CSS规范整理,粗略看了一下后还蛮有一定的道理,并自问是否有这样的规范,这也是初入前端开发的人一个很好的规范吧。
一、文件规范
1、文件均归档至约定的目录中。
具体要求通过豆瓣的CSS规范进行讲解:
所有的CSS分为两大类:通用类和业务类。通用的CSS文件,放在如下目录中:
基本样式库 /css/core
C++动态链接库创建与使用
你不认识的休道人
C++ dll
一、创建动态链接库
1.新建工程test中选择”MFC [dll]”dll类型选择第二项"Regular DLL With MFC shared linked",完成
2.在test.h中添加
extern “C” 返回类型 _declspec(dllexport)函数名(参数列表);
3.在test.cpp中最后写
extern “C” 返回类型 _decls
Android代码混淆之ProGuard
rensanning
ProGuard
Android应用的Java代码,通过反编译apk文件(dex2jar、apktool)很容易得到源代码,所以在release版本的apk中一定要混淆一下一些关键的Java源码。
ProGuard是一个开源的Java代码混淆器(obfuscation)。ADT r8开始它被默认集成到了Android SDK中。
官网:
http://proguard.sourceforge.net/
程序员在编程中遇到的奇葩弱智问题
tomcat_oracle
jquery 编程 ide
现在收集一下:
排名不分先后,按照发言顺序来的。
1、Jquery插件一个通用函数一直报错,尤其是很明显是存在的函数,很有可能就是你没有引入jquery。。。或者版本不对
2、调试半天没变化:不在同一个文件中调试。这个很可怕,我们很多时候会备份好几个项目,改完发现改错了。有个群友说的好: 在汤匙
解决maven-dependency-plugin (goals "copy-dependencies","unpack") is not supported
xp9802
dependency
解决办法:在plugins之前添加如下pluginManagement,二者前后顺序如下:
[html]
view plain
copy
<build>
<pluginManagement
 像这种标题跟数据没有整齐对应上,看起来乱