pyecharts形形色色的图表
前提:
有个朋友A想统计分析多张Excel文档中的数据,A对Excel操作不熟悉,导致耗费时间过多。由此想要用python帮忙处理。
刚好另外一个朋友B想学python
给B提出基层设想:
1、存在Excel文档,文档中存有数据为用户的生日及性别
2、通过python读取文档数据,通过生日转换获取对应用户的年龄,并进行年龄段统计
3、年龄段分别为:0-20岁、21-40岁、41-60岁、61-80岁、81-100岁、101岁及以上
4、统计分为:按用户年龄段统计、按性别进行年龄段统计
这个设想,不知道B完成了没?敬请期待。
后面给自己提了个设想:
1、连接数据库,存在用户基础信息
2、通过python随机生成100个用户身份证号,入库
3、读取100个用户身份证号通过规则获取生日、年龄、性别,入库
4、通过python,统计用户在年龄段中的数量,区分总用户年龄段、性别年龄段
5、用图表显示
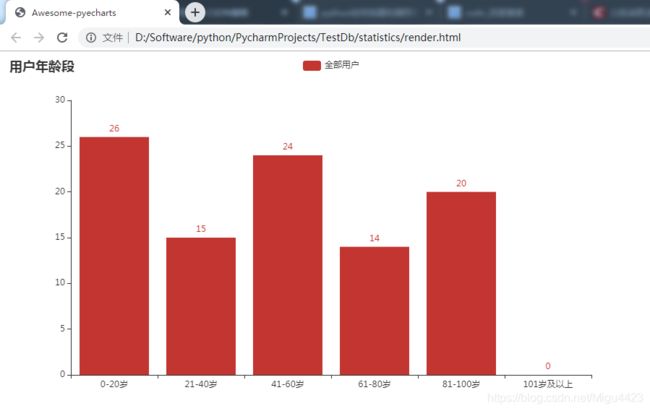
目前只做到了用户年龄段的图表展示:
代码如下:
#-*- coding:utf-8 -*-
__author__ = 'grit'
__time__ = '2019-12-04'
__dict__ = '此文件生成图表'

from pyecharts.charts import Bar
from pyecharts import options as opts
from sql_count import *
from sql_count_1 import *
from sql_count_2 import *
import mysql.connector

def connect_db():
    print('开始连接数据库')
    #打开数据库
    db = mysql.connector.connect(
        host='****',         # 数据库主机地址
        user='****',              # 数据库用户名
        passwd='****',          # 数据库密码
        database='enterprise_db_test',   # 连接已有数据库,如果不存在则报错
        autocommit=True
     )

    sql_countall= []
    cursor = db.cursor()
    for i in range(0,6):
        if i < 5:
            sql_count = 'SELECT count(*) FROM `bus_user` where AGE > {0} and AGE <= {1}' .format(0+20*i,20+20*i)
            cursor.execute(sql_count)
            data_sql = cursor.fetchall()
            sql_countall.append(int(data_sql[0][0]))
        else:
            sql_count = 'SELECT count(*) FROM `bus_user` where AGE > {0}'.format(100)
            cursor.execute(sql_count)
            data_sql = cursor.fetchall()
            sql_countall.append(int(data_sql[0][0]))
        #print(int(data_sql[0][0]))
    print(sql_countall)
    cursor.close()
    db.close()
    return sql_countall


# V1 版本开始支持链式调用
def getmybar():
    datacount=connect_db()
    bar = (
        Bar()
        .add_xaxis(["0-20岁", "21-40岁", "41-60岁", "61-80岁", "81-100岁", "101岁及以上"])
       # .add_yaxis("男性", [56, 55, 27, 101, 125, 27])
       # .add_yaxis("女性", [57, 134, 137, 129, 145, 60])
        .add_yaxis("全部用户", [datacount[0], datacount[1], datacount[2],datacount[3],datacount[4],datacount[5]])
        .set_global_opts(title_opts=opts.TitleOpts(title="用户年龄段"))
    )
    bar.render()  # bar.render("./MyFirstPyecharts.html") #指定生成html的路径,不指定会默认生成在当前路径下,命名为render.html


if __name__ == "__main__":
    getmybar()
运行代码结果:
D:\Software\Python38\python38.exe D:/Software/python/PycharmProjects/TestDb/statistics/EchartTest.py
开始连接数据库
[26, 15, 24, 14, 20, 0]

Process finished with exit code 0
