《数据分析与挖掘》里的 python函数积累
annotate标注文字
出自数据分析第三章P36
**
annotate语法说明 :annotate(s=‘str’ ,xy=(x,y) ,xytext=(l1,l2) ,…)
s 为注释文本内容
xy 为被注释的坐标点
xytext 为注释文字的坐标位置
import matplotlib.pyplot as plt
import numpy as np
x = np.arange(0, 6)
y = x * x
plt.plot(x, y, marker='o')
for xy in zip(x, y):
    plt.annotate("(%s,%s)" % xy, xy=xy, xytext=(-20, 10), textcoords='offset points')
plt.show()
plt.annotate(format(p[6], '.4%'), xy = (6, p[6]), xytext=(6*0.9, p[6]*0.9), arrowprops=dict(arrowstyle="->", connectionstyle="arc3,rad=.2"))
 #添加注释,即85%处的标记。这里包括了指定箭头样式。
**
.loc[n]
出自数据分析第三章P43
**
.loc[n]表示索引的是第n行(index 是整数)
loc[‘d’]表示索引的是第’d’行(index是字符)
.iloc[n]通过行号获取行数据,不能是字符
iloc[0:3] 输出0至3行所有列内容
pd.Series(model.labels_).value_counts()
出自数据分析与挖掘第五章P108
**
model.labels_:表示把kmeans模型标签取出:
array([1, 1, 0, 1, 1, 1, 1, 1, 1, 0, 1, 1, 0, 0, 1, 0, 2, 1, 1, 1, 1, 1,
0, 1, 1, 0, 1, 0, 1, 2, 0, 1, 1, 0, 0, 0, 1, 1, 2, 1, 1, 0, 1, 1,
0, 1, 1, 1, 0, 0, 1, 1, 1, 0, 1, 1, 1, 2, 1, 1, 1, 0, 0, 1, 0, 1,
1, 1, 1, 1, 0, 0, 1, 1, 0, 1, 2, 0, 0, 1, 1, 1, 1, 1, 1, 0, 0, 1,
1, 0, 2, 1, 0, 0, 1, 1, 0, 1, 0, 0])
pd.Series(model.labels_)将array转变为pd.series类型
0 1
1 1
2 0
3 1
4 1
5 1
6 1
7 1
8 1
9 0
10 1
11 1
12 0
13 0
14 1
15 0
.value_counts():统计series中不同的类别标签的数目
concat([DF1,DF2],axis = 0/1)
出自第八章 P187
**
import pandas as pd
import numpy as np
from pandas import DataFrame,Series
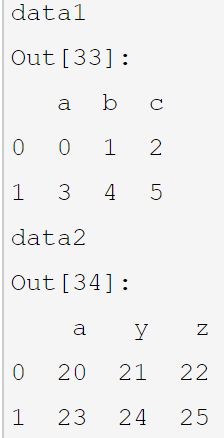
data1=pd.DataFrame(np.arange(6).reshape(2,3),columns=list('abc'))
data2=pd.DataFrame(np.arange(20,26).reshape(2,3),columns=list('ayz'))
data=pd.concat([data1,data2],axis=0)
data=pd.concat([data1,data2],axis=1)
data[u’发生时间’] = pd.to_datetime(data[u’发生时间’], format = ‘%Y%m%d%H%M%S’)
出自第十章P209
**
将时间的字符串表示变成时间的表示
比如原始的字符串是

就变成了这样的

格式符 说明
%a 星期的英文单词的缩写:如星期一, 则返回 Mon
%A 星期的英文单词的全拼:如星期一,返回 Monday
%b 月份的英文单词的缩写:如一月, 则返回 Jan
%B 月份的引文单词的缩写:如一月, 则返回 January
%c 返回datetime的字符串表示,如03/08/15 23:01:26
%d 返回的是当前时间是当前月的第几天
%f 微秒的表示: 范围: [0,999999]
%H 以24小时制表示当前小时
%I 以12小时制表示当前小时
%j 返回 当天是当年的第几天 范围[001,366]
%m 返回月份 范围[0,12]
%M 返回分钟数 范围 [0,59]
%P 返回是上午还是下午–AM or PM
%S 返回秒数 范围 [0,61]。。。手册说明的
%U 返回当周是当年的第几周 以周日为第一天
%W 返回当周是当年的第几周 以周一为第一天
%w 当天在当周的天数,范围为[0, 6],6表示星期天
%x 日期的字符串表示 :03/08/15
%X 时间的字符串表示 :23:22:08
%y 两个数字表示的年份 15
%Y 四个数字表示的年份 2015
%z 与utc时间的间隔 (如果是本地时间,返回空字符串)
%Z 时区名称(如果是本地时间,返回空字符串)
cumsum()用法
出自第十章P209
**
cumsum()适用于对每列或者每行数进行累加的
如书中d.cumsum()对于d进行处理,而d是一个Series类型
cumsum()什么参数都写 = cumsum(0),对列进行累加
a = pd.DataFrame([[1,2,3],[0,9,2]])

a
Out[79]:
   0  1  2
0  1  2  3
1  0  9  2

a.cumsum(0)
Out[80]:
   0   1  2
0  1   2  3
1  1  11  5
cumsum(1)表示对行进行累加(在上面基础上):
a.cumsum(1)
Out[81]:
   0  1   2
0  1  3   6
1  0  9  11
以上都是对DataFrame操作,如果对Series操作:
arr = pd.Series([2,3,4,5,6,5])

arr
Out[75]:
0    2
1    3
2    4
3    5
4    6
5    5
dtype: int64

arr.cumsum()
Out[77]:
0     2
1     5
2     9
3    14
4    20
5    25
dtype: int64
read__excel(Name,header = None,index_col = 0)参数的含义
**
import pandas as pd
input_file = 'test_index.xlsx'
data = pd.read_excel(input_file)
如果直接导入表格的话,会自动给列加上索引,data是这样的:

如果不想要这个默认的索引,就想以表格第一列作为索引:
data = pd.read_excel(input_file,index_col = 0)
data = pd.read_excel(input_file,index_col = 0,header = None)
.hist()
绘制频数分布直方图
matplotlib.pyplot.hist(
x, bins=10, range=None, normed=False,
weights=None, cumulative=False, bottom=None,
histtype=u'bar', align=u'mid', orientation=u'vertical',
rwidth=None, log=False, color=None, label=None, stacked=False,
hold=None, **kwargs)
画分布情况条状图,横坐标是数值,纵坐标是,该区间段所对应的个数:

y_train = train_data['SalePrice']
y_train.hist()
一共14000个数值,分布情况如上图


