数据分析实战 | SVM算法——病例自动诊断分析
目录
一、数据分析及对象
二、目的及分析任务
三、方法及工具
四、数据读入
五、数据理解
六、数据准备
七、模型训练
八、模型应用及评价
一、数据分析及对象
CSV文件——“bc_data.csv”
数据集链接:https://download.csdn.net/download/m0_70452407/88524905
该数据集主要记录了569个病例的32个属性,主要属性/字段如下:
(1)ID:病例的ID。
(2)Diagnosis(诊断结果):M为恶性,B为良性。该数据集共包含357个良性病例和212个恶性病例。
(3)细胞核的10个特征值,包括radius(半径)、texture(纹理)、perimeter(周长)、面积(area)、平滑度(smoothness)、紧凑度(compactness)、凹面(concavity)、凹点(concave points)、对称性(symmetry)和分形维数(fractal dimension)等。同时,为上述10个特征值分别提供了3种统计量,分别为均值(mean)、标准差(standard error)和最大值(worst or largest)。
二、目的及分析任务
(1)使用训练集对SVM模型进行训练。
(2)使用SVM模型对威斯康星乳腺癌数据集的诊断结果进行预测。
(3)对SVM模型进行评价。
三、方法及工具
Python语言及pandas、NumPy、matplotlib、scikit-learn包。
svm.SVC的超参数及其解读:
| 参数名称 | 参数类型 | 说明 |
| C | 浮点型,必须为正,默认值为1.0 | 在sklearn.svm.SVC中使用的惩罚是L2范数的平方,C对应的是此惩罚的正则化参数,即惩罚的系数。C值越大,则表明对分类错误的惩罚越大,因此分类结果更倾向于全正确的情况;C值越小,则表明对分类错误的惩罚越小,因此分类结果将允许更多的错误。 |
| kernel | 可以是以下中的任意字符:’linear','poly','rbf','sigmoid','precomputed';默认为'rbf'。 | 核函数类型,'rbf'为径向基函数,'linear'为线性核,'poly'为多项式核函数 |
| degree | 类型int,默认值为3 | 当指定kernel为'poly'时,表示选择的多项式的最高次数,默认为三次多项式(poly) |
| gamma | 'scale'、’auto'或者'float',默认值为'scale'(在0.22版本之前,默认为'auto' | gamma为'rbf'、’poly'、'sigmoid'的核系数。 |
| decision_function_shape | 默认为'ovr',只有两个值可供选择'ovr'和'ovo' | 在处理多分类问题时,确定采用某种策略。'ovr'表示一对一的分类器,假如有k个类别,则需要构建k*(k-1)/2个分类器;'ovo'为一对多的分类器,假如有k个类别,则需要构建k个分类器。 |
四、数据读入
导入需要的第三方包:
import pandas as pd
import numpy as np
import matplotlib.pyplot

#导入sklearn的svm
from sklearn import svm

#导入metrics评估方法
from sklearn import metrics

#train_test_split用于拆分训练集和测试集
from sklearn.model_selection import train_test_split

#StandardScalery作用是去均值和方差归一化
from sklearn.preprocessing import StandardScaler
读入数据:
df_bc_data=pd.read_csv("D:\\Download\\JDK\\数据分析理论与实践by朝乐门_机械工业出版社\\第4章 分类分析\\bc_data.csv")对数据集进行显示:
df_bc_data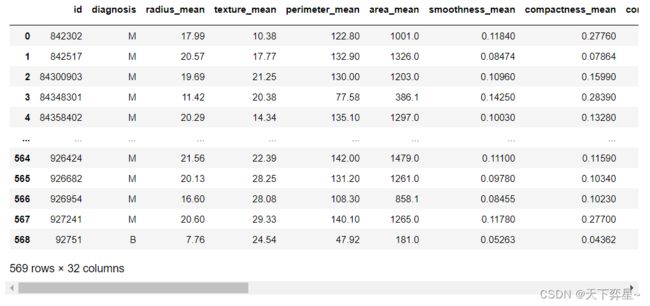
五、数据理解
对数据框df_bc_data进行探索性分析,这里采用的实现方法为调用pandas包中数据框(DataFrame)的describe()方法。
df_bc_data.describe()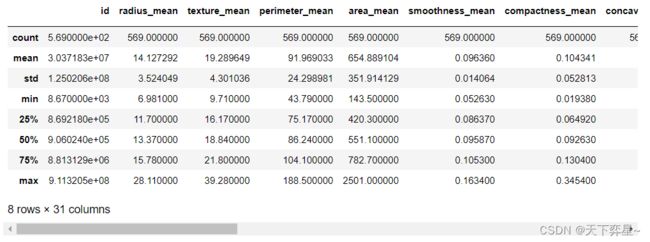
查看数据集中是否存在缺失值:
df_bc_data.info()RangeIndex: 569 entries, 0 to 568 Data columns (total 32 columns): # Column Non-Null Count Dtype --- ------ -------------- ----- 0 id 569 non-null int64 1 diagnosis 569 non-null object 2 radius_mean 569 non-null float64 3 texture_mean 569 non-null float64 4 perimeter_mean 569 non-null float64 5 area_mean 569 non-null float64 6 smoothness_mean 569 non-null float64 7 compactness_mean 569 non-null float64 8 concavity_mean 569 non-null float64 9 concave points_mean 569 non-null float64 10 symmetry_mean 569 non-null float64 11 fractal_dimension_mean 569 non-null float64 12 radius_se 569 non-null float64 13 texture_se 569 non-null float64 14 perimeter_se 569 non-null float64 15 area_se 569 non-null float64 16 smoothness_se 569 non-null float64 17 compactness_se 569 non-null float64 18 concavity_se 569 non-null float64 19 concave points_se 569 non-null float64 20 symmetry_se 569 non-null float64 21 fractal_dimension_se 569 non-null float64 22 radius_worst 569 non-null float64 23 texture_worst 569 non-null float64 24 perimeter_worst 569 non-null float64 25 area_worst 569 non-null float64 26 smoothness_worst 569 non-null float64 27 compactness_worst 569 non-null float64 28 concavity_worst 569 non-null float64 29 concave_points_worst 569 non-null float64 30 symmetry_worst 569 non-null float64 31 fractal_dimension_worst 569 non-null float64 dtypes: float64(30), int64(1), object(1) memory usage: 142.4+ KB
查看数据是否存在不均衡的问题:
df_bc_data['diagnosis'].value_counts()B 357 M 212 Name: diagnosis, dtype: int64
六、数据准备
由于id一列并非为自变量或因变量,删除该列。
new_bc=df_bc_data.drop(['id'],axis=1)将diagnosis属性字段的取值,'M'使用1代替,'B'使用0代替。
new_bc['diagnosis']=new_bc['diagnosis'].map({'M':1,'B':0})将数据集拆分为训练集和测试集,这里使用20%的数据作为测试集。
bc_train,bc_test=train_test_split(new_bc,test_size=0.2)将训练集和测试集的数据属性和标签进行拆分。
#对训练集的数据和标签进行拆分
bc_train_data=bc_train.iloc[:,1:]
bc_train_label=bc_train['diagnosis']
#对测试集的数据和标签进行拆分
bc_test_data=bc_test.iloc[:,1:]
bc_test_label=bc_test['diagnosis']
为了排除数值的量纲对结果的影响,需要对训练数据和预测数据进行标准化处理。
bc_train_data=StandardScaler().fit_transform(bc_train_data)
bc_test_data=StandardScaler().fit_transform(bc_test_data)
七、模型训练
使用训练集训练SVM模型。除了直接指定参数的数值之外,还可以使用自动调参计数(如GridSearchCV)进行参数选择。
bc_model=svm.SVC(C=0.2,kernel='linear') #创建SVM分类器
bc_model.fit(bc_train_data,bc_train_label)  #训练模型
SVC(C=0.2, kernel='linear')
八、模型应用及评价
使用已经训练好的SVM模型,在测试集上进行测试,并输出评价指标的取值。
#在测试集上应用模型,并进行评价
prediction=bc_model.predict(bc_test_data)
#评价指标
print("混淆矩阵:\n",metrics.confusion_matrix(bc_test_label,prediction))
print("准确率:",metrics.accuracy_score(bc_test_label,prediction))
print('查准率:',metrics.precision_score(bc_test_label,prediction))
print('召回率:',metrics.recall_score(bc_test_label,prediction))
print("F1值:",metrics.f1_score(bc_test_label,prediction))
混淆矩阵: [[74 0] [ 1 39]] 准确率: 0.9912280701754386 查准率: 1.0 召回率: 0.975 F1值: 0.9873417721518987