利用Python栅格化地图,含代码(以成都市为例)
这里写目录标题
- 利用Python实现栅格化地图
-
- python代码实现
利用Python实现栅格化地图
python代码实现
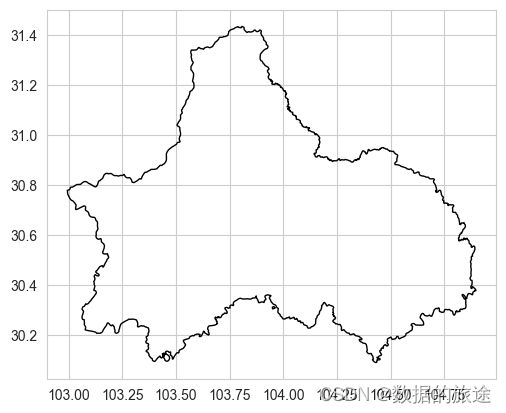
读取成都市边界的图层文件(.shp),并可视化
import geopandas as gpd

cd_shape = gpd.read_file('Chengdu/Chengdu.shp')
cd_shape.plot(edgecolor='k',facecolor='none')
下面这个栅格地图的类是我自己写的,类的参数主要有
rasterDataPath:图层文件的路径length:栅格单元的长度,单位为 m
class RasterData:

    def __init__(self, raster_data_path: str, length: float):
        self.raster = gpd.read_file(raster_data_path)
        self.length = length/1000 * 0.009
        self.polygons = []
        self.grid_ids = []
        self.x_min, self.y_min, self.x_max, self.y_max = self.raster.total_bounds
        self.rows, self.cols = self.grid_shape()

    def grid_shape(self) -> tuple:
        rows = int(math.ceil((self.y_max - self.y_min) / float(self.length)))
        cols = int(math.ceil((self.x_max - self.x_min) / float(self.length)))
        return rows, cols

    def grid_num(self) -> int:
        return self.rows * self.cols

    def grid_map(self) -> gpd.GeoDataFrame:
        points_list = []
        for row in range(self.rows):
            for col in range(self.cols):
                center_point_x = self.x_min + self.length / 2 + col * self.length
                center_point_y = self.y_min + self.length / 2 + row * self.length

                points = [Point(center_point_x + dx * self.length / 2,
                                center_point_y + dy * self.length / 2)
                          for dx, dy in [(-1, 1), (1, 1), (1, -1), (-1, -1)]]
                points_list.append(points)

        polygons = [Polygon(points) for points in points_list]
        grid_ids = list(range(len(polygons)))

        grid = gpd.GeoDataFrame({'geometry': polygons, 'grid_id': grid_ids}, crs=self.raster.crs)
        return grid

    # 计算栅格与区域的交集
    def grid_intersection(self, region: gpd.GeoDataFrame) -> gpd.GeoDataFrame:
        grid = self.grid_map()
        intersection_data = gpd.overlay(grid, region, how='intersection')
        return intersection_data
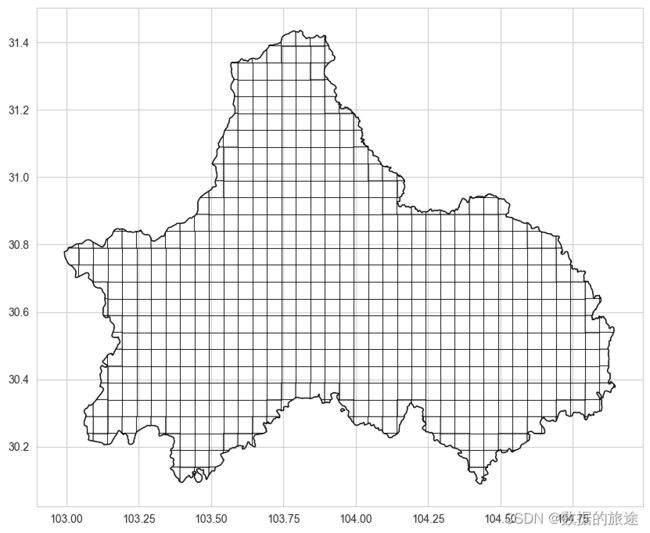
实例化对象并调用grid_map方法
grid = RasterData('Chengdu/Chengdu.shp', 2000) # 实例化对象
grid_data = grid.grid_map() # 调用grid_map方法进行栅格化
# 将两个图层绘制在一起
fig, ax = plt.subplots(figsize=(10, 10))
# 加粗绘图的线宽
cd_shape.plot(ax=ax, edgecolor='k', linewidth=1, facecolor='none')
grid_data.plot(ax=ax, edgecolor='k', linewidth=0.5, facecolor='none')
得到栅格模型,但此时的栅格是根据成都市边界的最大范围进行划分的,很多时候我们需要的是地理边界内部的栅格,因此需要调用grid_intersection方法

# 将两个图层绘制在一起
fig, ax = plt.subplots(figsize=(10, 10))
# 加粗绘图的线宽
intersection_data = grid.grid_intersection(cd_shape)
cd_shape.plot(ax=ax, edgecolor='k', linewidth=1, facecolor='none')
intersection_data.plot(ax=ax, edgecolor='k', linewidth=0.5, facecolor='none')
最终就得到了栅格化后的数据,是DataFrame格式的,其中grid_id代表栅格编号,geometry代码当前栅格的多边形要素
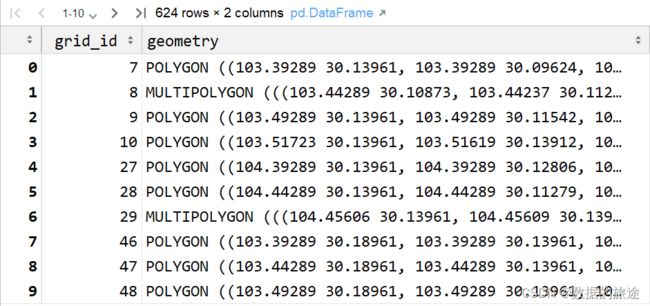
最后,如果这篇博客对各位有用的话,可以点点收藏和关注,如果有不懂的问题可以在评论区一起讨论