NetworkX入门及实战教程
NetworkX入门及实战教程
- 环境要求和工具包安装
- 自带图的绘制
- 连接表和邻接表创建图
-
- 通过连接表edge list创建图
- 可视化
- 查看全图参数
- 保存并载入邻接表
- 用NetworkX创建图
-
- 创建空图
- 添加单个节点
- 添加多个节点
- 添加带属性的节点
- 可视化
- Note
- 用NetworkX创建连接
-
- 创建单个连接
- 创建多个连接
- 节点连接数(Node degree)
- nx.draw出图美化
-
- 原生可视化
- 高级设置
- 设置每个节点的坐标(例如地铁坐标是有自己的分布位置的,想保留这种空间信息)
- 有向图代码美化模板(论文绘图专用)
- 计算节点特征
-
- Node Degree
- Degree Centrality
- Node Degree分析
-
- 最大连通域子图
- 每个节点的连接数(degree)
- Eigenvector Centrality
- Betweenness Centrality
- Closeness Centrality
- PageRank
- Katz Centralily
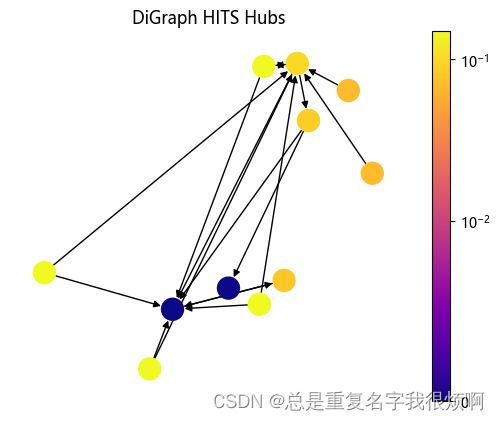
- HITS Hubs and Authorities
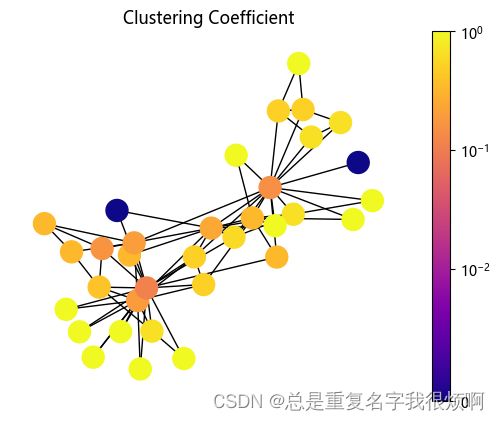
- Clustering Coefficient
- Briges
- Common Neighbors & Jaccard Coefficient & Adamic Adar Index
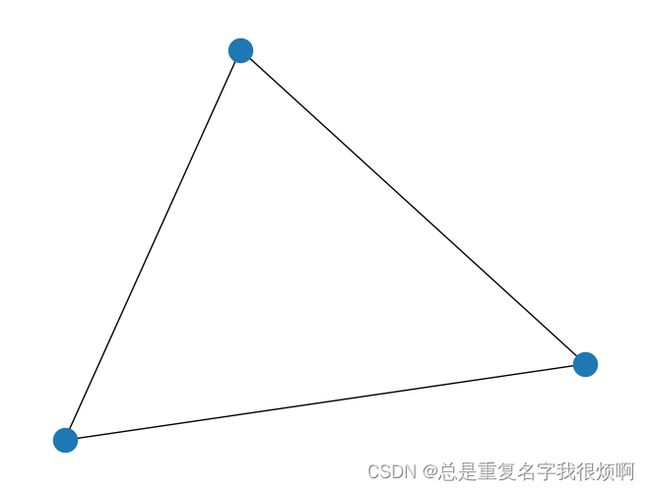
- Graphlet特征
- 拉普拉斯矩阵分解
-
- 计算拉普拉斯矩阵L和节点degree对角矩阵D
- 计算归一化拉普拉斯矩阵Ln和特征值分解
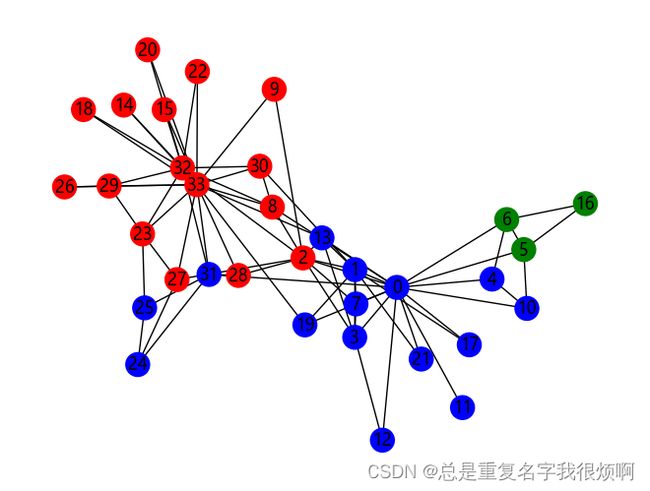
- 社群检测
NetworkX是一个基于Python的库,用于创造、操作复杂网络,是专门用作网络分析的工具包。
手动防爬虫,作者CSDN:总是重复名字我很烦啊,联系邮箱[email protected]
环境要求和工具包安装
Anaconda环境,安装jupyter notebook即可。以下所有操作都是在jupyter中进行。建议在anaconda中创建一个新的独立虚拟环境,取名networkX。

在jupyter notebook中输入以下代码,完成相关依赖的初步安装,后续有需求会单独说明。
!pip install numpy pandas matplotlib tqdm networkx scipy -i https://pypi.tuna.tsinghua.edu.cn/simple
运行nx.__version__可以查看networkx的版本。这一步如果没有报错,则说明安装成功。
import networkx as nx
import matplotlib.pyplot as plt
nx.__version__
自带图的绘制
| 图名称 | 代码 |
|---|---|
| 全连接无向图 | G = nx.complete_graph(7) |
| 全连接有向图 | G = nx.complete_graph(7, nx.DiGraph()) |
| 环状图 | G = nx.cycle_graph(5) |
| 梯状图 | G = nx.ladder_graph(5) |
| 线性串珠图 | G = nx.path_graph(15) |
| 星状图 | G = nx.star_graph(7) |
| 轮辐图 | G = nx.wheel_graph(7) |
| 二项树 | G = nx.binomial_tree(5) |
| 二维矩形网络 | G = nx.grid_2d_graph(3,5) |
| 多维矩形网络 | G = nx.grid_graph(dim=(2,3,4)) |
| 二维三角形网络图 | G = nx.triangular_lattice_graph(2,5) |
| 二维六边形蜂窝图 | G = nx.hexagonal_lattice_graph(2,3) |
| n维超立方体 | G = nx.hypercube_graph(4) |
| 钻石图 | G = nx.diamond_graph() |
| frucht图 | G = nx.frucht_graph() |
| 房子图 | G = nx.house_graph() |
| 封顶房子图 | G = nx.house_x_graph() |
| 彼得森图 | G = nx.petersen_graph() |
| krackhardt图 | G = nx.krackhardt_kite_graph() |
| 随机图 | G = nx.erdos_renyi_graph(10,0.5) |
| ## 无标度有向图(20%的节点拥有80%的连接) | G = nx.scale_free_graph(100) |
| 社交网络图(拳击俱乐部) | G = nx.karate_club_graph() |
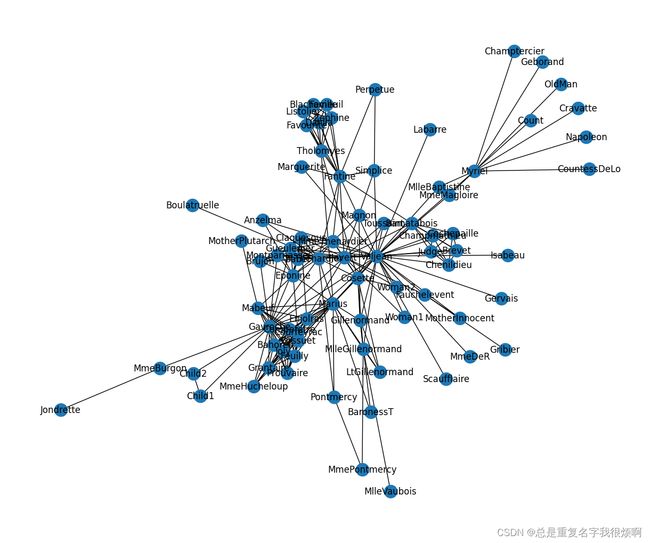
| 社交网络图(雨果悲惨世界) | G = nx.les_miserables_graph() |
| 家庭图 | G = nx.florentine_families_graph() |
| 社群聚类 | G = nx.caveman_graph(4,3) |
| 树图 | tree = nx.random_tree(n=10, seed=0) |
这里具体展示几个常见的代码:
# 树
tree = nx.random_tree(n=10, seed=0)
print(nx.forest_str(tree,sources=[0]))
# 家庭图
G = nx.florentine_families_graph()
nx.draw(G, with_labels=True)
# 雨果悲惨世界小说人物关系
G = nx.les_miserables_graph()
plt.figure(figsize=(12,10))
pos = nx.spring_layout(G, seed=10)
nx.draw(G, pos, with_labels=True)
# 空手道俱乐部样例数据集
G = nx.karate_club_graph()
nx.draw(G, with_labels=True)
连接表和邻接表创建图
导入数据
# 数据来源:http://www.openkg.cn/dataset/ch4masterpieces
df = pd.read_csv('data(广东外贸外语大学)/三国演义/triples.csv')
df.head()
通过连接表edge list创建图
# 创建有向图
G = nx.DiGraph()
edges = [edge for edge in zip(df['head'], df['tail'])]
G.add_edges_from(edges)
G.edges('关羽')
>> OutEdgeDataView([('关羽', '刘备'), ('关羽', '张飞')])
可视化
pos = nx.spring_layout(G, seed = 123)
plt.figure(figsize=(15,15))
nx.draw(G, pos=pos, with_labels = True)
查看全图参数
print(G, len(G), G.size(), G.nodes)
保存并载入邻接表
for line in nx.generate_adjlist(G):
    print(line)
    break
# 将邻接表导出为本地文件 grid.edgelist
nx.write_edgelist(G, path='grid.edgelist', delimiter=":")

# 从本地读取grid.edgelist邻接表
H = nx.read_edgelist(path='grid.edgelist', delimiter=":")

# 可视化
pos = nx.spring_layout(H, iterations=3, seed = 5)
plt.figure(figsize=(15,14))
nx.draw(G, pos=pos, with_labels = True)
用NetworkX创建图
创建空图
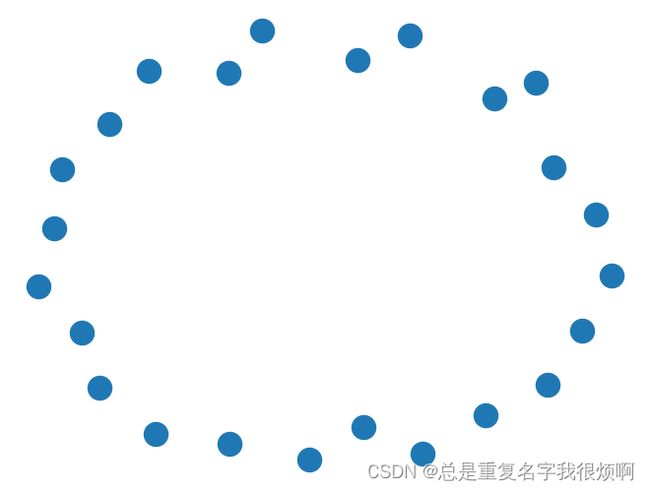
G = nx.Graph()
nx.draw(G)
添加单个节点
# 节点可以是中文英文字符串
G.add_node('刘备')
G.add_node('Tommy')
G.add_node('1')
G.nodes
>>NodeView(('刘备', 'Tommy', '1'))
添加多个节点
G.add_nodes_from(['诸葛亮','曹操'])
G.add_nodes_from(range(100,105))
G.nodes
>>NodeView(('刘备', 'Tommy', '1', '诸葛亮', '曹操', 100, 101, 102, 103, 104))
添加带属性的节点
G.add_nodes_from([
    ('关羽',{'武器':'青龙偃月刀','武力值':90,'智力值':80}),
    ('张飞',{'武器':'丈八蛇矛','武力值':85,'智力值':75}),
    ('吕布',{'武器':'方天画戟','武力值':100,'智力值':70})
])
G.nodes
>>NodeView(('刘备', 'Tommy', '1', '诸葛亮', '曹操', 100, 101, 102, 103, 104, '关羽', '张飞', '吕布'))
可视化
nx.draw(G)
# 创建另一个首尾相连的path graph
H = nx.path_graph(10)
nx.draw(H)
# 把H节点添加到G中
G.add_nodes_from(H)
G.nodes
>>NodeView(('刘备', 'Tommy', '1', '诸葛亮', '曹操', 100, 101, 102, 103, 104, '关羽', '张飞', '吕布', 0, 1, 2, 3, 4, 5, 6, 7, 8, 9))
nx.draw(G)
# 把H整张图作为一个节点添加到G中
G.add_node(H)
G.nodes
>>NodeView(('刘备', 'Tommy', '1', '诸葛亮', '曹操', 100, 101, 102, 103, 104, '关羽', '张飞', '吕布', 0, 1, 2, 3, 4, 5, 6, 7, 8, 9, <networkx.classes.graph.Graph object at 0x00000240BE5625B0>))
nx.draw(G)
Note
任何可哈希的对象,比如字符串、图像、XML对线甚至另一个Graph都可以作为节点。通过这种方式可以多模态的构建图网络。
用NetworkX创建连接
# 无向图
G = nx.Graph()
G.is_directed()
>> Flase

H = nx.DiGraph()
H.is_directed()
>> True
首先创建节点
# 创建单个节点
G.add_node(0, features=5, label=0, tezheng2=2)
# 创建2个节点
G.add_nodes_from([
    ('node1',{'feature1':1, 'feature2':2, 'feature3':3}),
    ('node2',{'feature1':4, 'feature2':5, 'feature3':6}),
])
G.number_of_nodes()
>>3
for node in G.nodes(data=True):
    print(node)
>>(0, {'features': 5, 'label': 0, 'tezheng2': 2})
('node1', {'feature1': 1, 'feature2': 2, 'feature3': 3})
('node2', {'feature1': 4, 'feature2': 5, 'feature3': 6})
创建单个连接
# 0节点和node1节点之间创建连接
G.add_edge(0, 'node1', weight=0.5, like=3)
创建多个连接
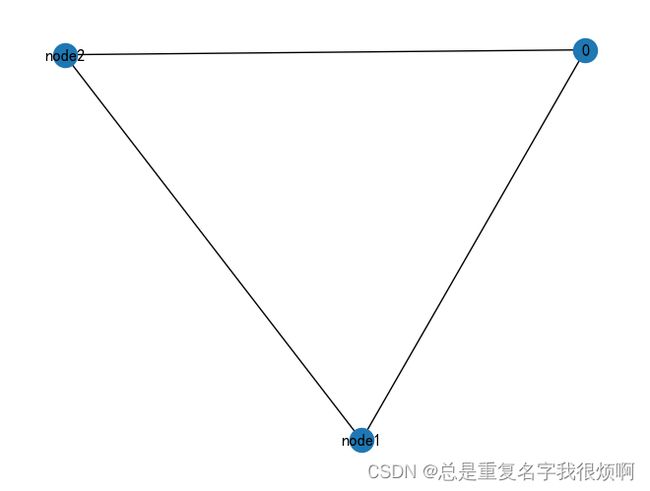
G.add_edges_from([
    ('node1','node2',{'weight':0.3, 'like':5}),
    ('node2',0,{'weight':0.1, 'like':8})
])
# 可视化
nx.draw(G, with_labels=True)
节点连接数(Node degree)
node_id = 'node1'
G.degree[node_id]
>>2

for neighbor in G.neighbors(node_id):
    print('Node {} has neighbor {}'.format(node_id, neighbor))
>>Node node1 has neighbor 0
Node node1 has neighbor node2
nx.draw出图美化
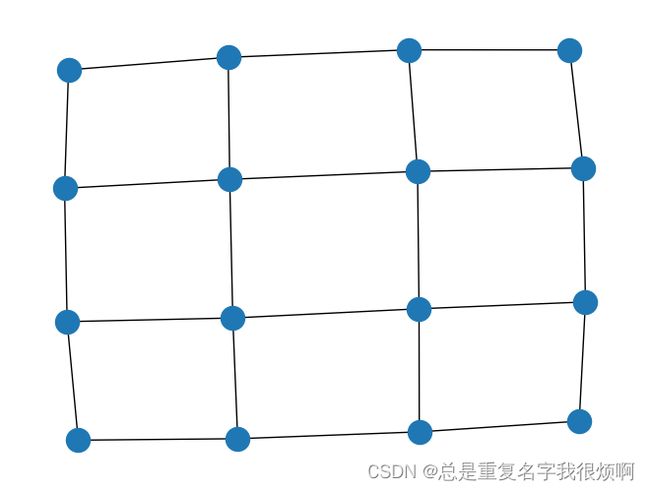
# 创建4x4网络图
G = nx.grid_2d_graph(4,4)
原生可视化
pos = nx.spring_layout(G, seed=123)
nx.draw(G, pos=pos)
# 不显示节点 node_size=0
nx.draw(G, pos=pos, node_size=0)
高级设置
# 无向图
nx.draw(
    G,
    node_color = 'orange', # 节点颜色
    edgecolors='red',      # 节点外边缘颜色
    edge_color = 'blue',    # edge颜色
    # edge_cmap=plt.cm.plasma, # 配色方案
    node_size = 800,
    with_labels = False,
    width =3,)
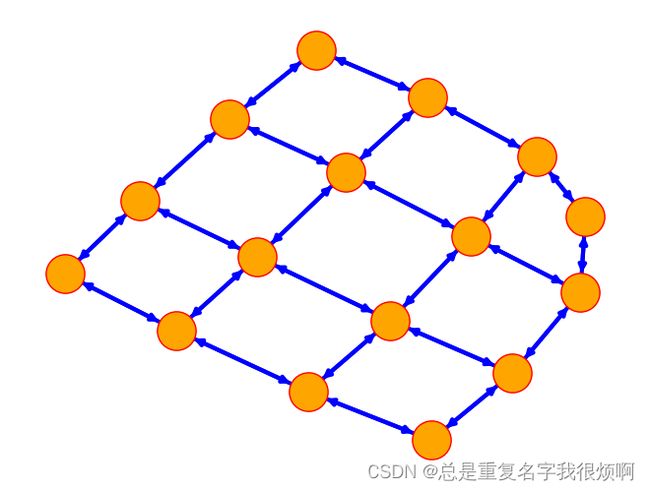
# 有向图
nx.draw(
    G.to_directed(),
    node_color = 'orange', # 节点颜色
    edgecolors='red',      # 节点外边缘颜色
    edge_color = 'blue',    # edge颜色
    # edge_cmap=plt.cm.coolwarm, # 配色方案
    node_size = 800,
    with_labels = False,
    width =3,
)
设置每个节点的坐标(例如地铁坐标是有自己的分布位置的,想保留这种空间信息)
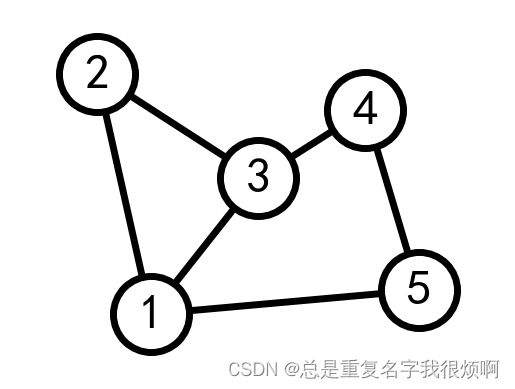
# 无向图
G = nx.Graph()
G.add_edge(1,2)
G.add_edge(1,3)
G.add_edge(1,5)
G.add_edge(2,3)
G.add_edge(3,4)
G.add_edge(4,5)
nx.draw(G)
pos = {1:(0,0), 2:(-1,0.3), 3:(2,0.17), 4:(4,0.255), 5:(5, 0.03)}

options = {
    'font_size':36,
    'node_size':3000,
    'node_color':'white',
    'edgecolors':'black',
    'linewidths':5,
    'width':5
}

nx.draw_networkx(G, pos=pos, **options)

ax = plt.gca()
ax.margins(0.20)
plt.axis('off')
plt.show()
# 有向图
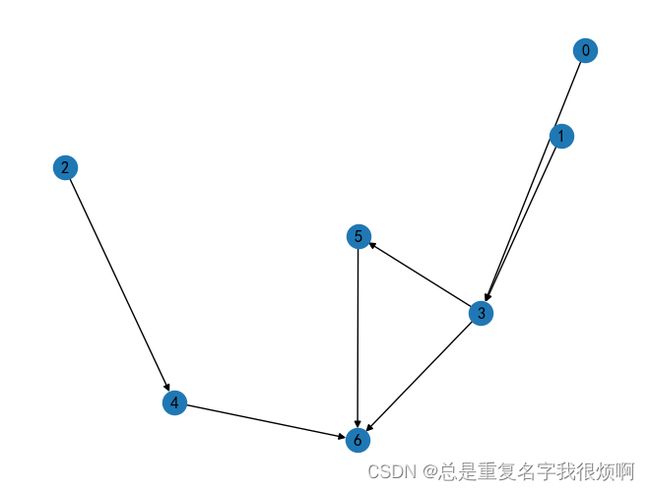
G = nx.DiGraph([(0,3), (1,3), (2,4), (3,5), (3,6), (4,6), (5,6)])
nx.draw(G, with_labels=True)
# 可视化每一列包含的节点
left_nodes = [0, 1, 2]
middle_nodes = [3, 4]
right_nodes = [5, 6]

# 可视化每个节点坐标
pos = {n:(0, i) for i, n in enumerate(left_nodes)}
pos.update({n: (1, i+0.5) for i, n in enumerate(middle_nodes)})
pos.update({n: (2, i+0.5) for i, n in enumerate(right_nodes)})

nx.draw(G, pos=pos, with_labels=True, **options)

ax = plt.gca()
ax.margins(0.20)
plt.axis('off')
plt.show()
有向图代码美化模板(论文绘图专用)
原图:
seed = 13648
G = nx.random_k_out_graph(10, 3, 0.5, seed=seed)
pos = nx.spring_layout(G, seed = seed)
nx.draw(G, pos, with_labels = True)
node_sizes = [12 + 10 * i for i in range(len(G))]

M = G.number_of_edges()
edge_colors = range(2, M+2)

edge_alphas = [(5 + i) / (M + 4) for i in range(M)]

cmap = plt.cm.plasma

plt.figure(figsize=(10,8))

nodes = nx.draw_networkx_nodes(G, pos, node_size=node_sizes, node_color='indigo')

edges = nx.draw_networkx_edges(
    G,
    pos,
    node_size=node_sizes,
    arrowstyle='->',
    arrowsize =20,
    edge_color=edge_colors,
    edge_cmap = cmap,
    width = 4
)

for i in range(M):
    edges[i].set_alpha(edge_alphas[i])

pc = mpl.collections.PathCollection(edges, cmap=cmap)
pc.set_array(edge_colors)
plt.colorbar(pc)

ax = plt.gca()
ax.set_axis_off()
plt.show()
计算节点特征
首先定义一个画图的辅助函数,方便后续绘制。
# 定义可视化辅助函数
def draw(G, pos, measures, measure_name):
    nodes = nx.draw_networkx_nodes(G, pos, node_size=250, cmap=plt.cm.plasma,
                                   node_color = list(measures.values()),
                                   nodelist=measures.keys())
    nodes.set_norm(mcolors.SymLogNorm(linthresh=0.01, linscale=1, base=10))
    # labels = nx.draw_networkx_labels(G, pos)
    edges = nx.draw_networkx_edges(G, pos)

    # plt.figure(figsize=(10,8))
    plt.title(measure_name)
    plt.colorbar(nodes)
    plt.axis('off')
    plt.show()
导入无向图和有向图
# 导入无向图
G = nx.karate_club_graph()
pos = nx.spring_layout(G, seed=675)

# 导入有向图
DiG = nx.DiGraph()
DiG.add_edges_from([(2, 3), (3, 2), (4, 1), (4, 2), (5, 2), (5, 4),
                    (5, 6), (6, 2), (6, 5), (7, 2), (7, 5), (8, 2),
                    (8, 5), (9, 2), (9, 5), (10, 5), (11, 5)])
Node Degree
通过连接度可视化,颜色黄说明这个和这个点先连接的点越多。
# 无向图
draw(G, pos, dict(G.degree()), 'Node Degree')
Degree Centrality
实际上这个绘制和Degree是差不多的。因为只关注了连接度这一个指标。
# 无向图
draw(G, pos, nx.degree_centrality(G), 'Degree Centrality')

# 有向图,分in和out两个方向
draw(DiG, pos, nx.in_degree_centrality(DiG), 'in Degree Centrality')
draw(DiG, pos, nx.out_degree_centrality(DiG), 'out Degree Centrality')
Node Degree分析
绘制一个随机无向图:
G = nx.gnp_random_graph(100, 0.02, seed=10374196)
pos = nx.spring_layout(G, seed = 10)
nx.draw(G ,pos)
最大连通域子图
我们会发现这样一幅图内,有的点是连接的,有的点是分散的,因此我们可以找出最大连接子图:
Gcc = G.subgraph(sorted(nx.connected_components(G), key = len, reverse = True)[0])
pos = nx.spring_layout(Gcc, seed = 10396953)
nx.draw_networkx_nodes(Gcc, pos, node_size=20)
nx.draw_networkx_edges(Gcc, pos, alpha=0.4)
plt.figure(figsize=(12,8))
pos = nx.spring_layout(Gcc, seed = 10396953)

options = {
    'font_size':12,
    'node_size':350,
    'node_color':'white',
    'edgecolors':'black',
    'linewidths':1,
    'width':2
}

nx.draw_networkx(Gcc, pos, **options)

plt.title('Connected components of G', fontsize=20)
plt.axis('off')
plt.show()
每个节点的连接数(degree)
用G.degree()可以查看节点连接的情况:
G.degree()

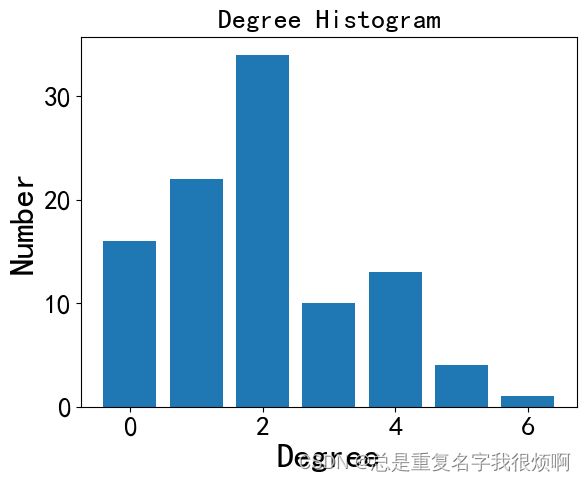
由于这个G.degree输出的结果比较混乱,因此我们需要统计后完成可视化工作。
# 梯子图
plt.plot(degree_sequence, 'b--', marker='o')
plt.title('Degree Rank Plot', fontsize=20)
plt.ylabel('Degree', fontsize=25)
plt.xlabel('Rank', fontsize=25)
plt.tick_params(labelsize=20) # 坐标轴文字大小
plt.show()
# 直方图
X = np.unique(degree_sequence, return_counts=True)[0]
Y = np.unique(degree_sequence, return_counts=True)[1]

plt.bar(X, Y)

plt.title('Degree Histogram', fontsize=20)
plt.ylabel('Number', fontsize=25)
plt.xlabel('Degree', fontsize=25)
plt.tick_params(labelsize=20) # 坐标轴文字大小
plt.show()
Eigenvector Centrality
这是一个很常规的思想:如果一个节点和他相邻的节点都很重要,那这个节点也很重要。
# 无向图
draw(G, pos, nx.eigenvector_centrality(G), 'Eigenvector Centrality')

# 有向图
draw(DiG, pos, nx.eigenvector_centrality_numpy(DiG), 'Eigenvector Centrality')
Betweenness Centrality
间重要度表示这个点是不是处于交通要道,一夫当关万夫莫开的位置。
# 无向图
draw(G, pos, nx.betweenness_centrality(G), 'Betweenness Centrality')

# 有向图
draw(DiG, pos, nx.betweenness_centrality(DiG), 'Betweenness Centrality')
Closeness Centrality
如果一个点到哪都近,那他的最近距离重要度就越高。
draw(G, pos, nx.closeness_centrality(G), 'Closeness Centrality')
PageRank
PageRank在传统图机器学习里有举足轻重的影响,因此后续会对PageRank的论文做精读,理解他的核心思想和贡献(敬请期待)。
draw(DiG, pos, nx.pagerank(DiG, alpha=0.85), 'PageRank')
此外,绘制一个简单的无向图
G = nx.star_graph(7)
nx.draw(G, with_labels = False)
pagerank = nx.pagerank(G, alpha=0.8)
注意,PageRank只能计算有向图,所以对无向图使用这样的工具后,会自动转化为有向图。
pagerank
>>{0: 0.4583348922684132,
 1: 0.07738072967594098,
 2: 0.07738072967594098,
 3: 0.07738072967594098,
 4: 0.07738072967594098,
 5: 0.07738072967594098,
 6: 0.07738072967594098,
 7: 0.07738072967594098}
Katz Centralily
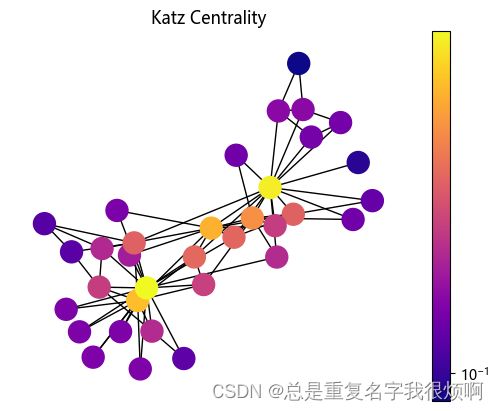
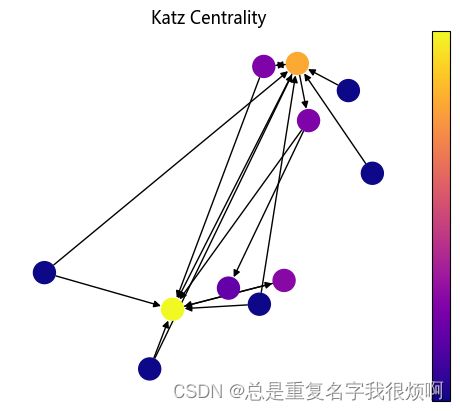
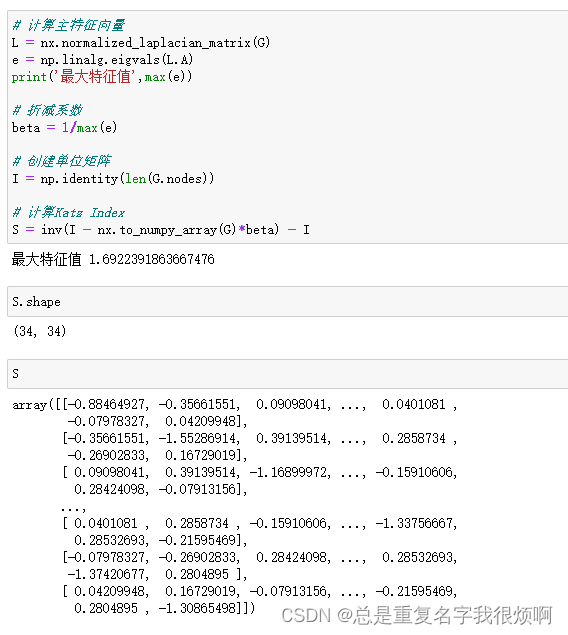
假如两个节点没有共同好友,那么这个时候共同好友个数、交并比都是0,但实际上这两个节点可能存在一定的联系。因此在这种情况,需要看全图信息。往往用卡姿系数(Katz index)来表示,他表示节点u和节点v之间长度为k的路径个数。
# 无向图
draw(G, pos, nx.katz_centrality(G, alpha=0.1, beta=1.0), 'Katz Centrality')

# 有向图
draw(DiG, pos, nx.katz_centrality(DiG, alpha=0.1, beta=1.0), 'Katz Centrality')
# 计算主特征向量
L = nx.normalized_laplacian_matrix(G)
e = np.linalg.eigvals(L.A)
print('最大特征值',max(e))

# 折减系数
beta = 1/max(e)

# 创建单位矩阵
I = np.identity(len(G.nodes))

# 计算Katz Index
S = inv(I - nx.to_numpy_array(G)*beta) - I
HITS Hubs and Authorities
h, a = nx.hits(DiG)
draw(DiG, pos, h, 'DiGraph HITS Hubs')
draw(DiG, pos, a, 'DiGraph HITS Authorities')
Clustering Coefficient
越抱团取暖的点,他的聚集系数就越大。
draw(G, pos, nx.clustering(G), 'Clustering Coefficient')
Briges
如果某个连接断掉,会使连通域个数增加,则该连接是brige,brige连接不属于环的一部分。例如上图右侧蓝色的,如果断开连接,那么整张图的连通域变成2个,所以他的连接属于brige。
用代码工具可以直接检测brige节点。
list(nx.bridges(G))
Common Neighbors & Jaccard Coefficient & Adamic Adar Index
领域关系的相关代码实现如下:
# Common Neighbors
sorted(nx.common_neighbors(G, 0, 4))

#  Jaccard Coefficient
preds = nx.jaccard_coefficient(G, [(0,1), (2,3)])
for u, v, p in preds:
    print(f'{u} , {v} -> {p:.8f}')

#  Adamic Adar Index
preds = nx.adamic_adar_index(G, [(0,1), (2,3)])
for u, v, p in preds:
    print(f'{u} , {v} -> {p:.8f}')
Graphlet特征
导入空手道俱乐部图
G = nx.karate_club_graph()
plt.figure(figsize=(10,8))
pos = nx.spring_layout(G, seed=123)
nx.draw(G, pos, with_labels=True)
指定Graphlet
target = nx.complete_graph(3)
nx.draw(target)
num = 0
for sub_nodes in itertools.combinations(G.nodes(), len(target.nodes())): # 遍历全图中符合graphlet节点个数的所有节点组合
    subg = G.subgraph(sub_nodes)                                         # 从全图中抽出子图
    if nx.is_connected(subg) and nx.is_isomorphic(subg, target):        #  如果子图是完整连通域,并且符合graphlet特征,输出原图节点编号
        num += 1
        print(subg.edges())
拉普拉斯矩阵分解
拉普拉斯矩阵常见的有两种,一种是普通拉普拉斯矩阵L,一种是归一化拉普拉斯矩阵Ln,具体计算公式如下:


创建图
n, m = 1000, 5000 # 1000个节点,5000个连接
G = nx.gnm_random_graph(n, m, seed=5040)
计算邻接矩阵
# 邻接矩阵
A = nx.adjacency_matrix(G)
A.shape
注意这里的A是一个非常稀疏的矩阵,可以用A.todense()变成稠密矩阵。
计算拉普拉斯矩阵L和节点degree对角矩阵D
# Laplacian Matrix
L = nx.laplacian_matrix(G)

# 对角矩阵D
D = L + A
D.todense()
计算归一化拉普拉斯矩阵Ln和特征值分解
L_n = nx.normalized_laplacian_matrix(G)
特征值分解
e = np.linalg.eigvals(L_n.A)
max(e), min(e)
>>(1.5924617911776022, -2.3557437655170784e-16)
直方图可视化
plt.figure(figsize=(12,8))
plt.hist(e, bins=100)
plt.xlim(0,2)

plt.title('Eigenvalue Histogram', fontsize=20)
plt.ylabel('Frequency', fontsize=25)
plt.xlabel('Eigenvalue', fontsize=25)
plt.tick_params(labelsize=20)
plt.show()
社群检测
import networkx as nx
import matplotlib.pyplot as plt
import warnings
warnings.filterwarnings('ignore')

plt.rcParams['font.sans-serif'] = ['Microsoft YaHei']
plt.rcParams['axes.unicode_minus']=False

G = nx.karate_club_graph()

from networkx.algorithms import community
communities = community.label_propagation_communities(G)

node_groups = []
for com in communities:
    node_groups.append(list(com))

color_map = []
for node_id in G:
    if node_id in node_groups[0]:
        color_map.append('blue')
    elif node_id in node_groups[1]:
        color_map.append('red')
    else:
        color_map.append('green')

nx.draw(G, node_color = color_map, with_labels=True)


