使用Bizchart搞出柱状图、折线图、饼图、渐变颜色光滑曲线图
自己是一个前端小菜鸟,最近在看BizChart的官方文档,文档里面的内容一言难尽…不过还好,秉持着拿来主义,加上自己练练手,其实也就还好,能够勉强够用罢了,没有啥技术含量的东西,下面就贴出我的代码:
首先是折线图:
import React, { Component } from 'react';
import { Chart, Geom, Axis, Tooltip, Legend } from 'bizcharts';

/**
 * 使用bizCharts完成图表
 */
class Line2 extends Component {
	render() {
		const data = [
			{
				month: 'Jan',
				city: 'Tokyo',
				temperature: 7
			},
			{
				month: 'Jan',
				city: 'London',
				temperature: 3.9
			},
			{
				month: 'Feb',
				city: 'Tokyo',
				temperature: 6.9
			},
			{
				month: 'Feb',
				city: 'London',
				temperature: 4.2
			},
			{
				month: 'Mar',
				city: 'Tokyo',
				temperature: 9.5
			},
			{
				month: 'Mar',
				city: 'London',
				temperature: 5.7
			},
			{
				month: 'Apr',
				city: 'Tokyo',
				temperature: 14.5
			},
			{
				month: 'Apr',
				city: 'London',
				temperature: 8.5
			},
			{
				month: 'May',
				city: 'Tokyo',
				temperature: 18.4
			},
			{
				month: 'May',
				city: 'London',
				temperature: 11.9
			},
			{
				month: 'Jun',
				city: 'Tokyo',
				temperature: 21.5
			},
			{
				month: 'Jun',
				city: 'London',
				temperature: 15.2
			},
			{
				month: 'Jul',
				city: 'Tokyo',
				temperature: 25.2
			},
			{
				month: 'Jul',
				city: 'London',
				temperature: 17
			},
			{
				month: 'Aug',
				city: 'Tokyo',
				temperature: 26.5
			},
			{
				month: 'Aug',
				city: 'London',
				temperature: 16.6
			},
			{
				month: 'Sep',
				city: 'Tokyo',
				temperature: 23.3
			},
			{
				month: 'Sep',
				city: 'London',
				temperature: 14.2
			},
			{
				month: 'Oct',
				city: 'Tokyo',
				temperature: 18.3
			},
			{
				month: 'Oct',
				city: 'London',
				temperature: 10.3
			},
			{
				month: 'Nov',
				city: 'Tokyo',
				temperature: 13.9
			},
			{
				month: 'Nov',
				city: 'London',
				temperature: 6.6
			},
			{
				month: 'Dec',
				city: 'Tokyo',
				temperature: 9.6
			},
			{
				month: 'Dec',
				city: 'London',
				temperature: 4.8
			}
		];

		const cols = {
			month: {
				range: [ 0, 1 ]
			}
		};

		return (
			<div>
				<Chart autoFit height={400} data={data} scale={cols} forceFit>
					<Legend />
					<Axis name="month" />
					<Axis
						name="temperature"
						label={{
							formatter: (val) => `${val}°C`
						}}
					/>
					<Tooltip
						crosshairs={{
							type: 'y'
						}}
					/>
					<Geom type="line" position="month*temperature" size={2} color={'city'} shape={'smooth'} />
					<Geom
						type="point"
						position="month*temperature"
						size={4}
						shape={'circle'}
						color={'city'}
						style={{
							stroke: '#fff',
							lineWidth: 1
						}}
					/>
				</Chart>
			</div>
		);
	}
}
export default Line2;
接下来是柱状图
import React, { Component } from 'react';
import { Chart, Geom, Axis, Tooltip, Legend, G2, setTheme } from 'bizcharts';
import DataSet from '@antv/data-set';

/**
 * 使用bizCharts完成图表
 */
class Line1 extends Component {
	render() {
		//数据源
		const data = [
			{
				name: 'London',
				'Jan.': 18.9,
				'Feb.': 28.8,
				'Mar.': 39.3,
				'Apr.': 81.4,
				May: 47,
				'Jun.': 20.3,
				'Jul.': 24,
				'Aug.': 35.6
			},
			{
				name: 'Berlin',
				'Jan.': 12.4,
				'Feb.': 23.2,
				'Mar.': 34.5,
				'Apr.': 99.7,
				May: 52.6,
				'Jun.': 35.5,
				'Jul.': 37.4,
				'Aug.': 42.4
			}
		];

		const ds = new DataSet();
		const dv = ds.createView().source(data);
		dv.transform({
			type: 'fold',
			fields: [ 'Jan.', 'Feb.', 'Mar.', 'Apr.', 'May', 'Jun.', 'Jul.', 'Aug.' ],
			// 展开字段集
			key: '月份',
			// key字段
			value: '月均降雨量'
			// value字段
		});

		return (
			<div>
				<Chart autoFit height={400} data={dv} forceFit>
					<Axis name="月份" />
					<Axis name="月均降雨量" />
					<Legend />
					<Tooltip
						crosshairs={{
							type: 'y'
						}}
					/>
					<Geom
						type="interval"
						position="月份*月均降雨量"
						color={'name'}
						adjust={[
							{
								type: 'dodge',
								marginRatio: 1 / 32
							}
						]}
					/>
				</Chart>
			</div>
		);
	}
}
export default Line1;
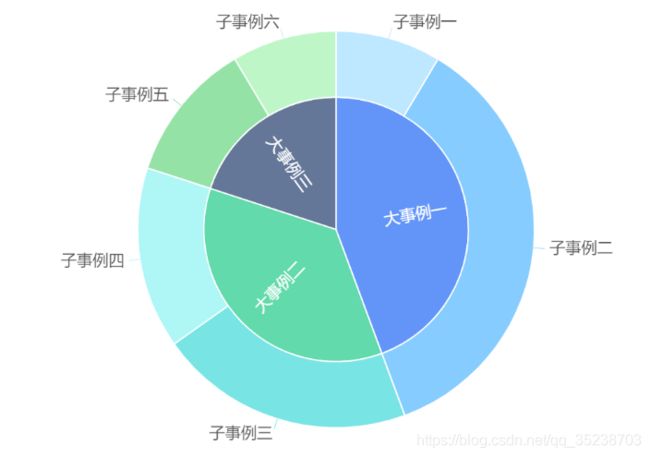
后面是嵌套式饼图
import React, { Component } from 'react';
import { DataView } from '@antv/data-set';
import { Chart, Interval, Tooltip, Legend, View, Axis, Coordinate } from 'bizcharts';

class Labelline extends Component {
	render() {
		const data = [
			{ value: 251, type: '大事例一', name: '子事例一' },
			{ value: 1048, type: '大事例一', name: '子事例二' },
			{ value: 610, type: '大事例二', name: '子事例三' },
			{ value: 434, type: '大事例二', name: '子事例四' },
			{ value: 335, type: '大事例三', name: '子事例五' },
			{ value: 250, type: '大事例三', name: '子事例六' }
		];
		// 通过 DataSet 计算百分比
		const dv = new DataView();
		dv.source(data).transform({
			type: 'percent',
			field: 'value',
			dimension: 'type',
			as: 'percent'
		});

		const dv1 = new DataView();
		dv1.source(data).transform({
			type: 'percent',
			field: 'value',
			dimension: 'name',
			as: 'percent'
		});

		return (
			<Chart
				height={400}
				data={dv.rows}
				autoFit
				scale={{
					percent: {
						formatter: (val) => {
							val = `${(val * 100).toFixed(2)}%`;
							return val;
						}
					}
				}}
			>
				<Coordinate type="theta" radius={0.5} />
				<Axis visible={false} />
				<Legend visible={false} />
				<Tooltip showTitle={false} />
				<Interval
					position="percent"
					adjust="stack"
					color="type"
					element-highlight
					style={{
						lineWidth: 1,
						stroke: '#fff'
					}}
					label={[
						'type',
						{
							offset: -15
						}
					]}
				/>

				<View data={dv1.rows}>
					<Coordinate type="theta" radius={0.75} innerRadius={0.5 / 0.75} />
					<Interval
						position="percent"
						adjust="stack"
						color={[ 'name', [ '#BAE7FF', '#7FC9FE', '#71E3E3', '#ABF5F5', '#8EE0A1', '#BAF5C4' ] ]}
						element-highlight
						style={{
							lineWidth: 1,
							stroke: '#fff'
						}}
						label="name"
					/>
				</View>
			</Chart>
		);
	}
}

export default Labelline;
最后是渐变颜色的光滑折线图
import React, { Component } from 'react';
import { Chart, Line } from 'bizcharts';

class Demo extends Component {
	render() {
		const data = [
			{ month: '2015-01-01', acc: 84.0 },
			{ month: '2015-02-01', acc: 14.9 },
			{ month: '2015-03-01', acc: 17.0 },
			{ month: '2015-04-01', acc: 20.2 },
			{ month: '2015-05-01', acc: 55.6 },
			{ month: '2015-06-01', acc: 56.7 },
			{ month: '2015-07-01', acc: 30.6 },
			{ month: '2015-08-01', acc: 63.2 },
			{ month: '2015-09-01', acc: 24.6 },
			{ month: '2015-10-01', acc: 14.0 },
			{ month: '2015-11-01', acc: 9.4 },
			{ month: '2015-12-01', acc: 7.3 }
		];
		return (
			//scale:缩放 padding:内边距 autoFit height根据块内内容自动调节高度
			<Chart scale={{ value: { min: 0 } }} padding={[ 10, 20, 50, 40 ]} autoFit height={500} data={data}>
				<Line
					shape="smooth"
					position="month*acc"
					color="l (270) 0:rgba(255, 146, 255, 1) .5:rgba(100, 268, 255, 1) 1:rgba(215, 0, 255, 1)"
				/>
			</Chart>
		);
	}
}

export default Demo;
所有相关的数据和配置在https://www.bizcharts.net/product/bizcharts/gallery
有同好的小伙伴欢迎交流鸭~~


