路径规划之 A* 算法
参考链接
原文地址
https://github.com/paulQuei/a-star-algorithm?spm=a2c6h.12873639.0.0.21834662LgAvMP
路径规划之 A* 算法
算法介绍
A*(念做:A Star)算法是一种很常用的路径查找和图形遍历算法。它有较好的性能和准确度。本文在讲解算法的同时也会提供Python语言的代码实现,并会借助matplotlib库动态的展示算法的运算过程。
A*算法最初发表于1968年,由Stanford研究院的Peter Hart, Nils Nilsson以及Bertram Raphael发表。它可以被认为是Dijkstra算法的扩展。
由于借助启发函数的引导,A*算法通常拥有更好的性能。
广度优先搜索
为了更好的理解A*算法,我们首先从广度优先(Breadth First)算法讲起。
正如其名称所示,广度优先搜索以广度做为优先级进行搜索。
从起点开始,首先遍历起点周围邻近的点,然后再遍历已经遍历过的点邻近的点,逐步的向外扩散,直到找到终点。
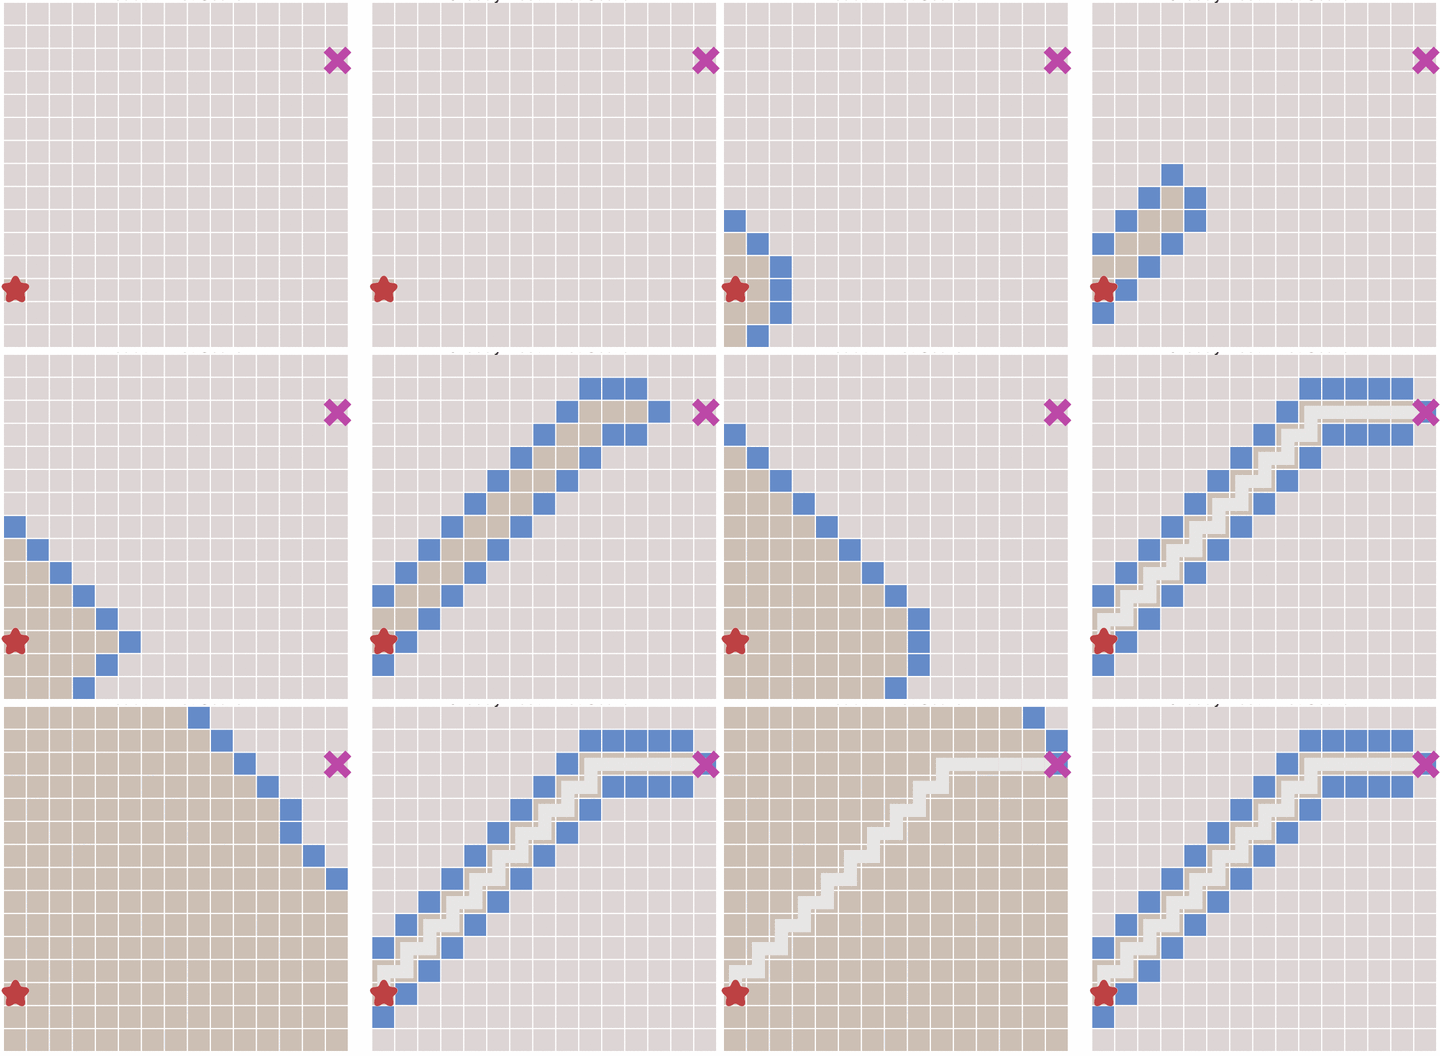
这种算法就像洪水(Flood fill)一样向外扩张,算法的过程如下图所示:
在上面这幅动态图中,算法遍历了图中所有的点,这通常没有必要。对于有明确终点的问题来说,一旦到达终点便可以提前终止算法,下面这幅图对比了这种情况:

在执行算法的过程中,每个点需要记录达到该点的前一个点的位置 – 可以称之为父节点。这样做之后,一旦到达终点,便可以从终点开始,反过来顺着父节点的顺序找到起点,由此就构成了一条路径。
Dijkstra算法
Dijkstra算法是由计算机科学家Edsger W. Dijkstra在1956年提出的。
Dijkstra算法用来寻找图形中节点之间的最短路径。
考虑这样一种场景,在一些情况下,图形中相邻节点之间的移动代价并不相等。例如,游戏中的一幅图,既有平地也有山脉,那么游戏中的角色在平地和山脉中移动的速度通常是不相等的。
在Dijkstra算法中,需要计算每一个节点距离起点的总移动代价。同时,还需要一个优先队列结构。对于所有待遍历的节点,放入优先队列中会按照代价进行排序。
在算法运行的过程中,每次都从优先队列中选出代价最小的作为下一个遍历的节点。直到到达终点为止。
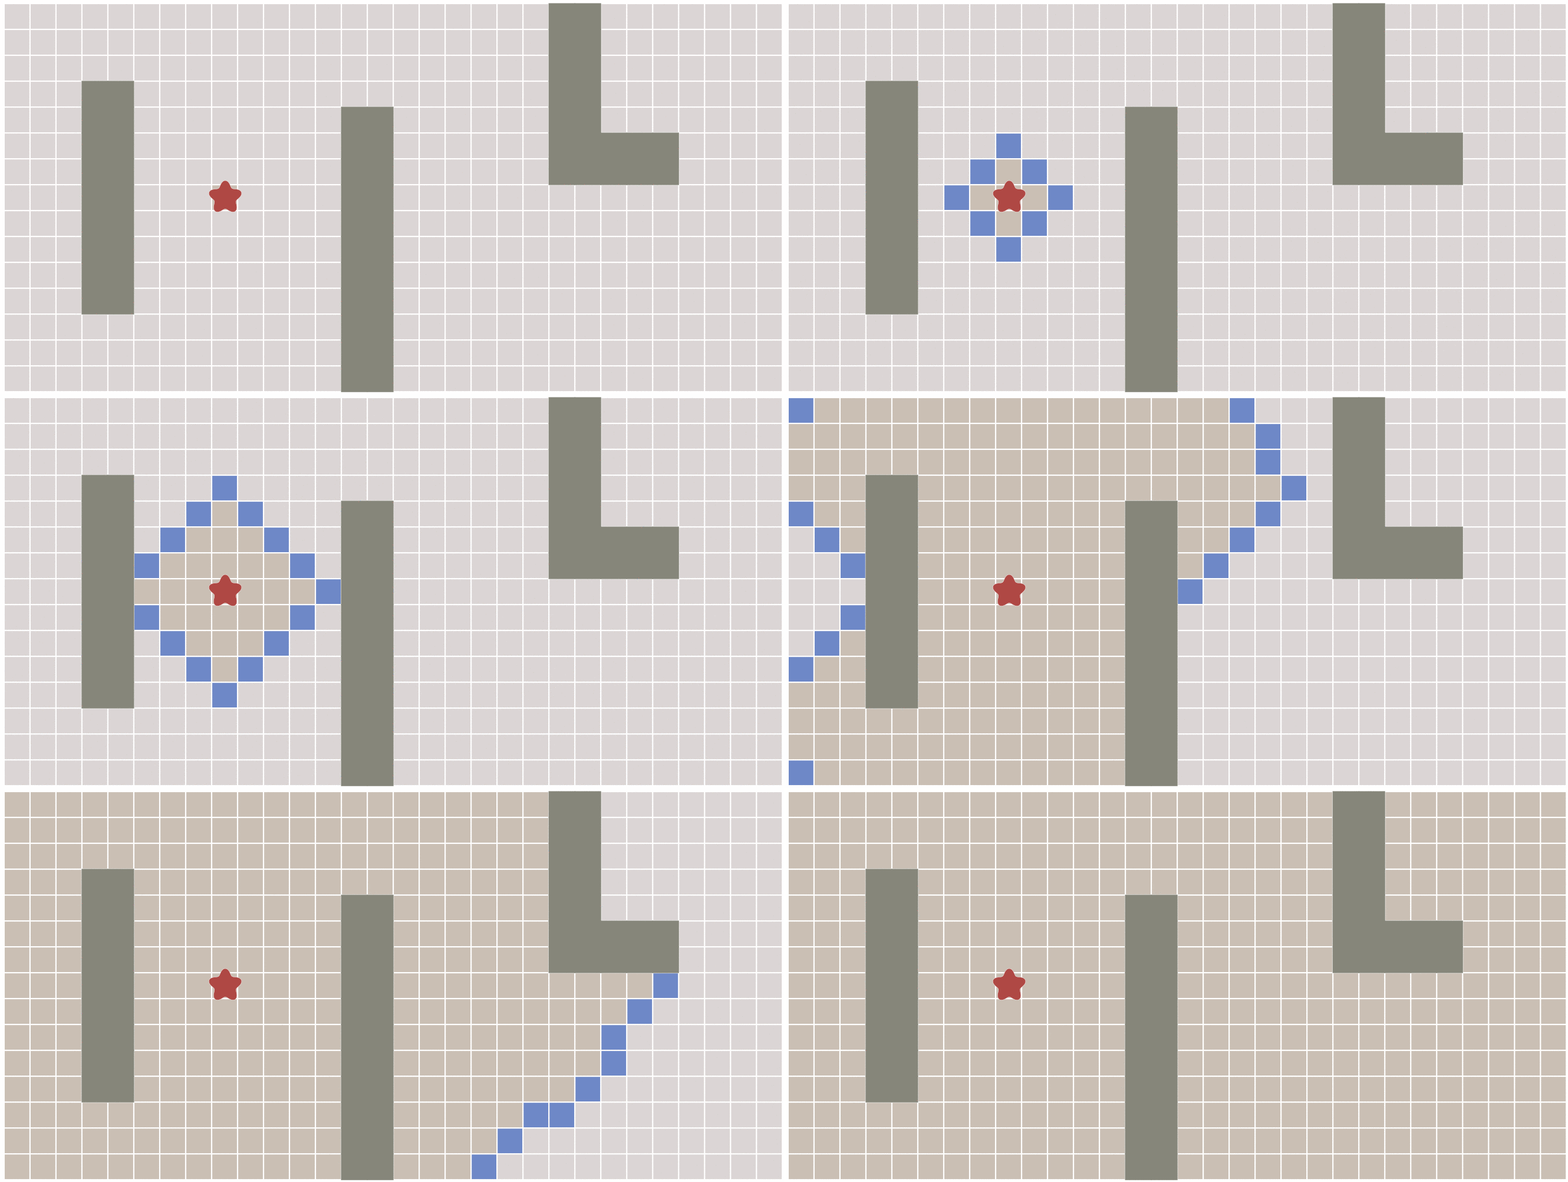
下面对比了不考虑节点移动代价差异的广度优先搜索与考虑移动代价的Dijkstra算法的运算结果:

当图形为网格图,并且每个节点之间的移动代价是相等的,那么Dijkstra算法将和广度优先算法变得一样。
最佳优先搜索
在一些情况下,如果我们可以预先计算出每个节点到终点的距离,则我们可以利用这个信息更快的到达终点。
其原理也很简单。与Dijkstra算法类似,我们也使用一个优先队列,但此时以每个节点到达终点的距离作为优先级,每次始终选取到终点移动代价最小(离终点最近)的节点作为下一个遍历的节点。这种算法称之为最佳优先(Best First)算法。
这样做可以大大加快路径的搜索速度,如下图所示:

但这种算法会不会有什么缺点呢?答案是肯定的。
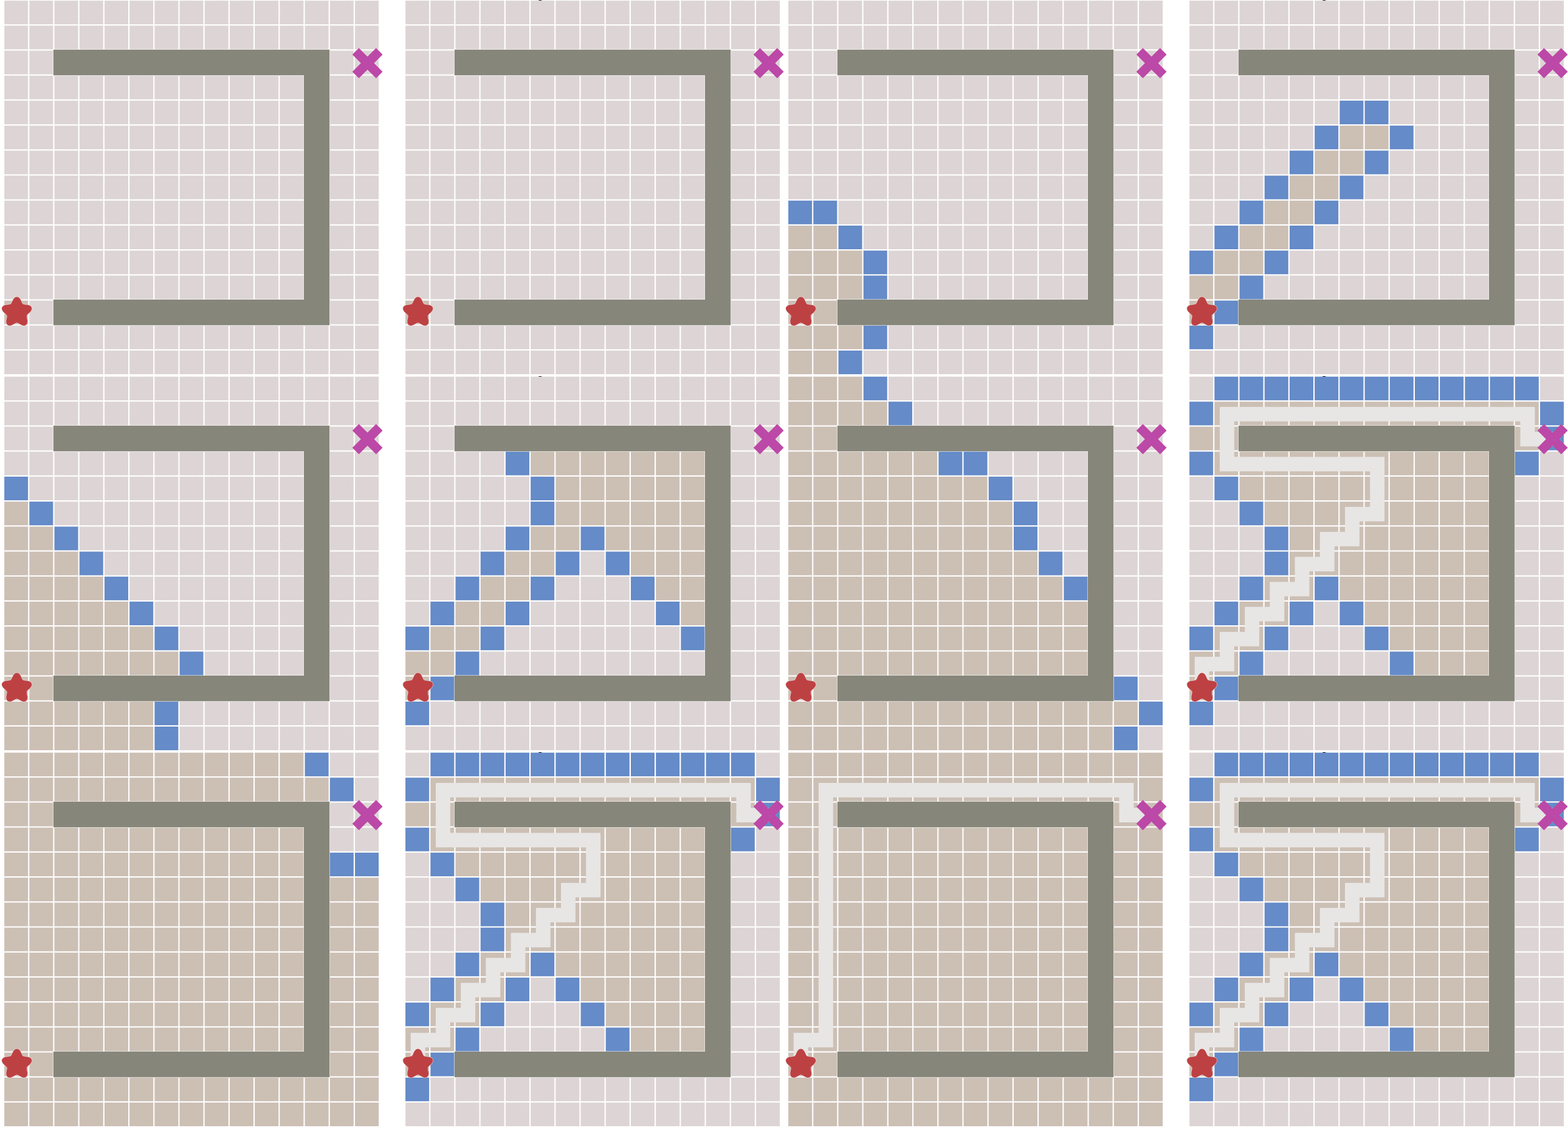
因为,如果起点和终点之间存在障碍物,则最佳优先算法找到的很可能不是最短路径,下图描述了这种情况。

A*算法
对比了上面几种算法,最后终于可以讲解本文的重点:A*算法了。
下面的描述我们将看到,A*算法实际上是综合上面这些算法的特点于一身的。
A*算法通过下面这个函数来计算每个节点的优先级。
f ( n ) = g ( n ) + h ( n ) f(n) = g(n)+h(n) f(n)=g(n)+h(n)
其中:
- f ( n ) f(n) f(n) 是节点n的综合优先级。当我们选择下一个要遍历的节点时,我们总会选取综合优先级最高(值最小)的节点。
- g ( n ) g(n) g(n) 是节点n距离起点的代价。
- h ( n ) h(n) h(n) 是节点n距离终点的预计代价,这也就是A*算法的启发函数。关于启发函数我们在下面详细讲解。
A* 算法在运算过程中,每次从优先队列中选取 f ( n ) f(n) f(n) 值最小(优先级最高)的节点作为下一个待遍历的节点。
另外,A*算法使用两个集合来表示待遍历的节点,已经遍历过的节点,这通常称之为open_set和close_set。
完整的A*算法描述如下:
* 初始化open_set和close_set;
* 将起点加入open_set中,并设置优先级为0(优先级最高);
* 如果open_set不为空,则从open_set中选取优先级最高的节点n:
    * 如果节点n为终点,则:
        * 从终点开始逐步追踪parent节点,一直达到起点;
        * 返回找到的结果路径,算法结束;
    * 如果节点n不是终点,则:
        * 将节点n从open_set中删除,并加入close_set中;
        * 遍历节点n所有的邻近节点:
            * 如果邻近节点m在close_set中,则:
                * 跳过,选取下一个邻近节点
            * 如果邻近节点m也不在open_set中,则:
                * 设置节点m的parent为节点n
                * 计算节点m的优先级
                * 将节点m加入open_set中
启发函数
上面已经提到,启发函数会影响A*算法的行为。
- 在极端情况下,当启发函数 h ( n ) h(n) h(n)始终为0,则将由 g ( n ) g(n) g(n)决定节点的优先级,此时算法就退化成了Dijkstra算法。
- 如果 h ( n ) h(n) h(n)始终小于等于节点n到终点的代价,则A* 算法保证一定能够找到最短路径。但是当 h ( n ) h(n) h(n)的值越小,算法将遍历越多的节点,也就导致算法越慢。
- 如果 h ( n ) h(n) h(n)完全等于节点n到终点的代价,则A* 算法将找到最佳路径,并且速度很快。可惜的是,并非所有场景下都能做到这一点。因为在没有达到终点之前,我们很难确切算出距离终点还有多远。
- 如果 h ( n ) h(n) h(n)的值比节点n到终点的代价要大,则A*算法不能保证找到最短路径,不过此时会很快。 在另外一个极端情况下,如果 h ( n ) h(n) h(n)相较于 g ( n ) g(n) g(n)大很多,则此时只有 h ( n ) h(n) h(n)产生效果,这也就变成了最佳优先搜索。
由上面这些信息我们可以知道,通过调节启发函数我们可以控制算法的速度和精确度。因为在一些情况,我们可能未必需要最短路径,而是希望能够尽快找到一个路径即可。这也是A* 算法比较灵活的地方。
对于网格形式的图,有以下这些启发函数可以使用:
- 如果图形中只允许朝上下左右四个方向移动,则可以使用曼哈顿距离(Manhattan distance)。
- 如果图形中允许朝八个方向移动,则可以使用对角距离。
- 如果图形中允许朝任何方向移动,则可以使用欧几里得距离(Euclidean distance)。
关于距离
曼哈顿距离
如果图形中只允许朝上下左右四个方向移动,则启发函数可以使用曼哈顿距离,它的计算方法如下图所示:

计算曼哈顿距离的函数如下,这里的D是指两个相邻节点之间的移动代价,通常是一个固定的常数。
function heuristic(node) =
    dx = abs(node.x - goal.x)
    dy = abs(node.y - goal.y)
    return D * (dx + dy)
对角距离
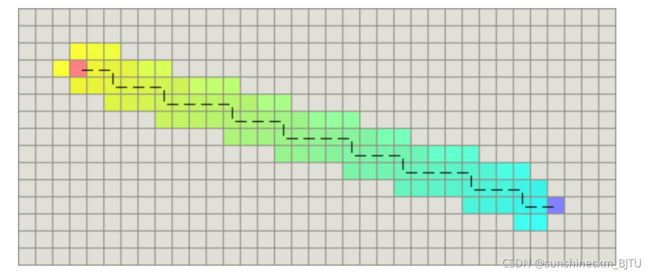
如果图形中允许斜着朝邻近的节点移动,则启发函数可以使用对角距离。它的计算方法如下:
计算对角距离的函数如下,这里的D2指的是两个斜着相邻节点之间的移动代价。如果所有节点都正方形,则其值就是 2 ∗ D \sqrt{2} * D 2∗D。
function heuristic(node) =
    dx = abs(node.x - goal.x)
    dy = abs(node.y - goal.y)
    return D * (dx + dy) + (D2 - 2 * D) * min(dx, dy)
欧几里得距离
如果图形中允许朝任意方向移动,则可以使用欧几里得距离。
欧几里得距离是指两个节点之间的直线距离,因此其计算方法也是我们比较熟悉的: ( p 2. x − p 1. x ) 2 + ( p 2. y − p 1. y ) 2 \sqrt{(p2.x-p1.x)^2 + (p2.y-p1.y)^2} (p2.x−p1.x)2+(p2.y−p1.y)2。其函数表示如下:
function heuristic(node) =
    dx = abs(node.x - goal.x)
    dy = abs(node.y - goal.y)
    return D * sqrt(dx * dx + dy * dy)
算法实现
算法的源码可以到github上下载:paulQuei/a-star-algorithm。
我们的算法演示的是在一个二维的网格图形上从起点找寻终点的求解过程。
坐标点与地图
首先,我们创建一个非常简单的类来描述图中的点,相关代码如下:
# point.py

import sys

class Point:
    def __init__(self, x, y):
        self.x = x
        self.y = y
        self.cost = sys.maxsize
接着,我们实现一个描述地图结构的类。为了简化算法的描述:
我们选定左下角坐标[0, 0]的点是算法起点,右上角坐标[size - 1, size - 1]的点为要找的终点。
为了让算法更有趣,我们在地图的中间设置了一个障碍,并且地图中还会包含一些随机的障碍。该类的代码如下:
# random_map.py

import numpy as np

import point

class RandomMap:
    def __init__(self, size=50): # 构造函数,地图的默认大小是50x50;
        self.size = size
        self.obstacle = size//8   # 设置障碍物的数量为地图大小除以8;
        self.GenerateObstacle() # 调用GenerateObstacle生成随机障碍物;

    def GenerateObstacle(self):
        self.obstacle_point = []
        self.obstacle_point.append(point.Point(self.size//2, self.size//2))
        self.obstacle_point.append(point.Point(self.size//2, self.size//2-1))

        # Generate an obstacle in the middle
        for i in range(self.size//2-4, self.size//2): # 在地图的中间生成一个斜着的障碍物;
            self.obstacle_point.append(point.Point(i, self.size-i))
            self.obstacle_point.append(point.Point(i, self.size-i-1))
            self.obstacle_point.append(point.Point(self.size-i, i))
            self.obstacle_point.append(point.Point(self.size-i, i-1))

        for i in range(self.obstacle-1):  # 随机生成其他几个障碍物;
            x = np.random.randint(0, self.size)
            y = np.random.randint(0, self.size)
            self.obstacle_point.append(point.Point(x, y))

            if (np.random.rand() > 0.5): # Random boolean  障碍物的方向也是随机的;
                for l in range(self.size//4):
                    self.obstacle_point.append(point.Point(x, y+l))
                    pass
            else:
                for l in range(self.size//4):
                    self.obstacle_point.append(point.Point(x+l, y))
                    pass

    def IsObstacle(self, i ,j): # 定义一个方法来判断某个节点是否是障碍物;
        for p in self.obstacle_point:
            if i==p.x and j==p.y:
                return True
        return False
算法主体
有了基本的数据结构之后,我们就可以开始实现算法主体了。
这里我们通过一个类来封装我们的算法。
首先实现一些算法需要的基本函数,它们如下:
# a_star.py

import sys
import time

import numpy as np

from matplotlib.patches import Rectangle

import point
import random_map

class AStar:
    def __init__(self, map): # __init__:类的构造函数。
        self.map=map
        self.open_set = []
        self.close_set = []

    def BaseCost(self, p): # BaseCost:节点到起点的移动代价,对应了上文的 g(n)。
        x_dis = p.x
        y_dis = p.y
        # Distance to start point
        return x_dis + y_dis + (np.sqrt(2) - 2) * min(x_dis, y_dis)

    def HeuristicCost(self, p): # HeuristicCost:节点到终点的启发函数,对应上文的$h(n)$。由于我们是基于网格的图形,所以这个函数和上一个函数用的是对角距离。
        x_dis = self.map.size - 1 - p.x
        y_dis = self.map.size - 1 - p.y
        # Distance to end point
        return x_dis + y_dis + (np.sqrt(2) - 2) * min(x_dis, y_dis)

    def TotalCost(self, p): # TotalCost:代价总和,即对应上面提到的 f(n)。
        return self.BaseCost(p) + self.HeuristicCost(p)

    def IsValidPoint(self, x, y): # IsValidPoint:判断点是否有效,不在地图内部或者障碍物所在点都是无效的。
        if x < 0 or y < 0:
            return False
        if x >= self.map.size or y >= self.map.size:
            return False
        return not self.map.IsObstacle(x, y)

    def IsInPointList(self, p, point_list): # 判断点是否在某个集合中。
        for point in point_list:
            if point.x == p.x and point.y == p.y:
                return True
        return False

    def IsInOpenList(self, p): # 判断点是否在open_set中。
        return self.IsInPointList(p, self.open_set)

    def IsInCloseList(self, p): # 判断点是否在close_set中。
        return self.IsInPointList(p, self.close_set)

    def IsStartPoint(self, p): # 判断点是否是起点。
        return p.x == 0 and p.y ==0

    def IsEndPoint(self, p): # 判断点是否是终点。
        return p.x == self.map.size-1 and p.y == self.map.size-1
有了上面这些辅助函数,就可以开始实现算法主逻辑了,相关代码如下:
# a_star.py
def RunAndSaveImage(self, ax, plt):
    start_time = time.time()

    start_point = point.Point(0, 0)
    start_point.cost = 0
    self.open_set.append(start_point)

    while True:
        index = self.SelectPointInOpenList()
        if index < 0:
            print('No path found, algorithm failed!!!')
            return
        p = self.open_set[index]
        rec = Rectangle((p.x, p.y), 1, 1, color='c')
        ax.add_patch(rec)
        self.SaveImage(plt)

        if self.IsEndPoint(p):
            return self.BuildPath(p, ax, plt, start_time)

        del self.open_set[index]
        self.close_set.append(p)

        # Process all neighbors
        x = p.x
        y = p.y
        self.ProcessPoint(x-1, y+1, p)
        self.ProcessPoint(x-1, y, p)
        self.ProcessPoint(x-1, y-1, p)
        self.ProcessPoint(x, y-1, p)
        self.ProcessPoint(x+1, y-1, p)
        self.ProcessPoint(x+1, y, p)
        self.ProcessPoint(x+1, y+1, p)
        self.ProcessPoint(x, y+1, p)
这段代码应该不需要太多解释了,它就是根据前面的算法逻辑进行实现。为了将结果展示出来,我们在算法进行的每一步,都会借助于matplotlib库将状态保存成图片。
上面这个函数调用了其他几个函数代码如下:
# a_star.py
def SaveImage(self, plt):
    millis = int(round(time.time() * 1000))
    filename = './' + str(millis) + '.png'
    plt.savefig(filename)

def ProcessPoint(self, x, y, parent):
    if not self.IsValidPoint(x, y):
        return # Do nothing for invalid point
    p = point.Point(x, y)
    if self.IsInCloseList(p):
        return # Do nothing for visited point
    print('Process Point [', p.x, ',', p.y, ']', ', cost: ', p.cost)
    if not self.IsInOpenList(p):
        p.parent = parent
        p.cost = self.TotalCost(p)
        self.open_set.append(p)

def SelectPointInOpenList(self):
    index = 0
    selected_index = -1
    min_cost = sys.maxsize
    for p in self.open_set:
        cost = self.TotalCost(p)
        if cost < min_cost:
            min_cost = cost
            selected_index = index
        index += 1
    return selected_index

def BuildPath(self, p, ax, plt, start_time):
    path = []
    while True:
        path.insert(0, p) # Insert first
        if self.IsStartPoint(p):
            break
        else:
            p = p.parent
    for p in path:
        rec = Rectangle((p.x, p.y), 1, 1, color='g')
        ax.add_patch(rec)
        plt.draw()
        self.SaveImage(plt)
    end_time = time.time()
    print('===== Algorithm finish in', int(end_time-start_time), ' seconds')
这三个函数应该是比较容易理解的:
- SaveImage:将当前状态保存到图片中,图片以当前时间命名。
- ProcessPoint:针对每一个节点进行处理:如果是没有处理过的节点,则计算优先级设置父节点,并且添加到open_set中。
- SelectPointInOpenList:从open_set中找到优先级最高的节点,返回其索引。
- BuildPath:从终点往回沿着parent构造结果路径。然后从起点开始绘制结果,结果使用绿色方块,每次绘制一步便保存一个图片。
测试入口
最后是程序的入口逻辑,使用上面写的类来查找路径:
# main.py

import numpy as np
import matplotlib.pyplot as plt

from matplotlib.patches import Rectangle

import random_map
import a_star

plt.figure(figsize=(5, 5))

map = random_map.RandomMap() ①

ax = plt.gca()
ax.set_xlim([0, map.size]) ②
ax.set_ylim([0, map.size])

for i in range(map.size): ③
    for j in range(map.size):
        if map.IsObstacle(i,j):
            rec = Rectangle((i, j), width=1, height=1, color='gray')
            ax.add_patch(rec)
        else:
            rec = Rectangle((i, j), width=1, height=1, edgecolor='gray', facecolor='w')
            ax.add_patch(rec)

rec = Rectangle((0, 0), width = 1, height = 1, facecolor='b')
ax.add_patch(rec) ④

rec = Rectangle((map.size-1, map.size-1), width = 1, height = 1, facecolor='r')
ax.add_patch(rec) ⑤

plt.axis('equal') ⑥
plt.axis('off')
plt.tight_layout()
#plt.show()

a_star = a_star.AStar(map)
a_star.RunAndSaveImage(ax, plt) ⑦
这段代码说明如下:
- 创建一个随机地图;
- 设置图像的内容与地图大小一致;
- 绘制地图:对于障碍物绘制一个灰色的方块,其他区域绘制一个白色的的方块;
- 绘制起点为蓝色方块;
- 绘制终点为红色方块;
- 设置图像的坐标轴比例相等并且隐藏坐标轴;
- 调用算法来查找路径;

