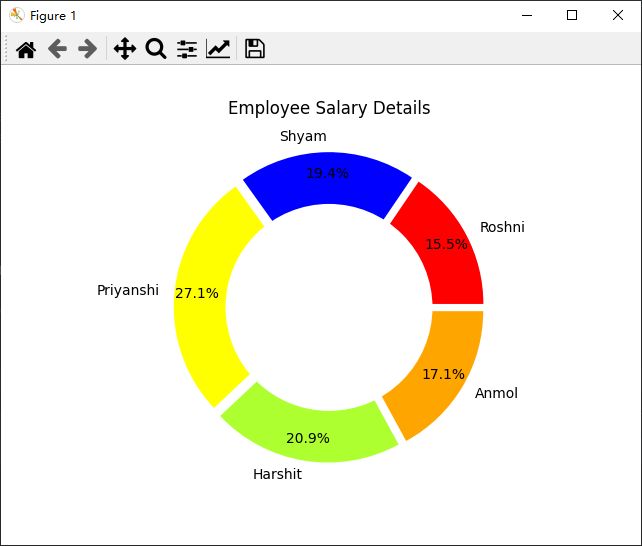
python科研绘图:圆环图
圆环图是一种特殊的图形,它可以显示各个部分与整体之间的关系。圆环图由两个或多个大小不一的饼图叠加而成,中间被挖空,看起来像一个甜甜圈。因此,圆环图也被称为“甜甜圈”图。
与饼图相比,圆环图的空间利用率更高,可以对比多组不同的数据。在圆环图中,数据源自数据表的行或列,排列在工作表的列或行中。它不仅能对比一组数据,还能对比多组不同的数据,更能突出地显示数据的分布情况。
此外,圆环图还可以显示文本信息,标题等。在圆环图中,中间空心的部分可以用来展示数据的总数,用圆环的弧长和颜色表示不同数据的占比,图表旁边有图例用来解释说明。
import matplotlib.pyplot as plt
# Setting labels for items in Chart
Employee = ['Roshni', 'Shyam', 'Priyanshi',
'Harshit', 'Anmol']
# Setting size in Chart based on
# given values
Salary = [40000, 50000, 70000, 54000, 44000]
# colors
colors = ['#FF0000', '#0000FF', '#FFFF00',
'#ADFF2F', '#FFA500']
# explosion
explode = (0.05, 0.05, 0.05, 0.05, 0.05)
# Pie Chart
plt.pie(Salary, colors=colors, labels=Employee,
autopct='%1.1f%%', pctdistance=0.85,
explode=explode)
# draw circle
centre_circle = plt.Circle((0, 0), 0.70, fc='white')
fig = plt.gcf()
# Adding Circle in Pie chart
fig.gca().add_artist(centre_circle)
# Adding Title of chart
plt.title('Employee Salary Details')
# Displaing Chart
plt.show()
import matplotlib.pyplot as plt

# 数据
labels = ['Label1', 'Label2', 'Label3', 'Label4']
sizes = [15, 30, 45, 10]
colors = ['gold', 'yellowgreen', 'lightcoral', 'lightskyblue']

# 绘图
fig1, ax1 = plt.subplots()
ax1.pie(sizes, labels=labels, colors=colors, autopct='%1.1f%%', startangle=90)
ax1.axis('equal')  # Equal aspect ratio ensures that pie is drawn as a circle.

# Draw a white circle at the center
centre_circle = plt.Circle((0, 0), 0.70, fc='white')
fig = plt.gcf()
fig.gca().add_artist(centre_circle)

plt.show()
