基于sysbench工具的压力测试---mycat+mysql架构
公司业务需求,需要提前测试mysql的并发,使用mycat和两个mysql节点搭建了一个小型的架构;
如图: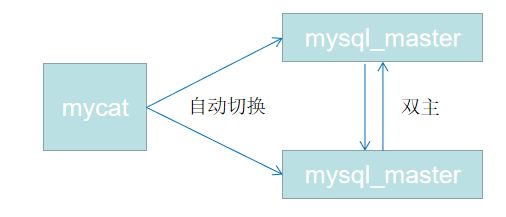
一、环境介绍
公司的情况比较特殊,数据库的应用场景几乎都是写,高并发写入,因为前期业务量在迁移,所以现在压力不大,后期可能出现6000+客户端并发写入,读取的场景却很少;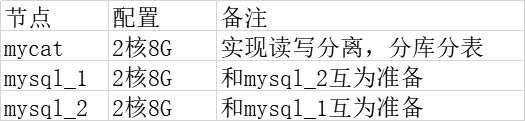
双主、mycat 环境自己搭建,这里不在赘述;
二、测试工具
1、mysql性能测试工具:sysbench
sysbench工具下载、安装:github https://github.com/akopytov/sysbench
参考url:
https://segmentfault.com/a/1190000015241184
https://cloud.tencent.com/developer/article/1068456
https://developer.aliyun.com/article/47347
https://www.cnblogs.com/klb561/p/10513620.html
--- 测试需要lua脚本,需要安装lua语言---
lua下载:http://www.lua.org/ftp/
安装:
1、解压
2、make linux
3、make install
报错解决:https://blog.csdn.net/weixin_44297303/article/details/96877250
2、sysbench 常用参数
测试命令实例
sysbench --threads=1000 --time=60 --report-interval=5 --db-driver=mysql --mysql-user=mycat --mysql-password=123456 --mysql-port=8066 --mysql-host=172.19.195.213 --mysql-db=db_mysqlslap oltp_insert prepare
sysbench --threads=5000 --time=60 --report-interval=5 --db-driver=mysql --mysql-user=mycat --mysql-password=123456 --mysql-port=8066 --mysql-host=172.19.195.213 --mysql-db=db_mysqlslap oltp_insert run
sysbench --threads=1000 --time=60 --report-interval=5 --db-driver=mysql --mysql-user=mycat --mysql-password=123456 --mysql-port=8066 --mysql-host=172.19.195.213 --mysql-db=db_mysqlslap oltp_insert cleanup
sysbench
--threads:并发数,这里模拟的是1000个客户端;
--time:测试时间,单位为秒;
--report-interval:每隔几秒输出一次详细结果;
--db-driver:测试的数据库,可以是mysql,postgresql等,
--mysql-user:数据库用户(因为这里测试入口是mycat,所以也创建也mycat用户);
--mysql-password:数据库密码;
--mysql-port:数据库端口号;
--mysql-host:数据库ip地址;
--mysql-db:针对哪个库进行测试(这里我新建了一个库,用于测试);
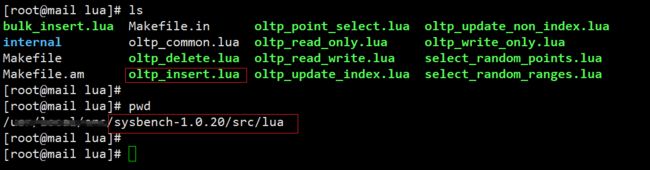
oltp_insert:测试的sql语句类型,因为场景为高并发写入,肯定是insert语句,所以选择oltp_insert;可以看到 oltp_insert 等参数是对应着sysbench解压包 src/lua/ 目录下的lua脚本的:
prepare:这个阶段是用来做准备的、建立好测试用的表、并向表中填充数据。
run:这个阶段是才是去跑压力测试的SQL
cleanup:这个阶段是去清除数据的、也就是prepare阶段初始化好的表要都drop掉。
三、测试过程及说明
1、四次测试
模拟1000客户端60S内持续写入
(已省略prepare阶段和cleanup阶段)
[root@nginx-001 mycat]# sysbench --threads=1000 --time=60 --report-interval=5 --db-driver=mysql --mysql-user=mycat --mysql-password=123456 --mysql-port=8066 --mysql-host=172.19.195.213 --mysql-db=db_mysqlslap oltp_insert run
sysbench 1.0.20 (using bundled LuaJIT 2.1.0-beta2)

Running the test with following options:
Number of threads: 1000
Report intermediate results every 5 second(s)
Initializing random number generator from current time


Initializing worker threads...

Threads started!

[ 5s ] thds: 1000 tps: 6715.60 qps: 6715.60 (r/w/o: 0.00/6715.60/0.00) lat (ms,95%): 267.41 err/s: 0.00 reconn/s: 0.00
[ 10s ] thds: 1000 tps: 7379.47 qps: 7379.47 (r/w/o: 0.00/7379.47/0.00) lat (ms,95%): 231.53 err/s: 0.00 reconn/s: 0.00
[ 15s ] thds: 1000 tps: 7295.48 qps: 7295.48 (r/w/o: 0.00/7295.48/0.00) lat (ms,95%): 240.02 err/s: 0.00 reconn/s: 0.00
[ 20s ] thds: 1000 tps: 7101.97 qps: 7101.97 (r/w/o: 0.00/7101.97/0.00) lat (ms,95%): 240.02 err/s: 0.00 reconn/s: 0.00
[ 25s ] thds: 1000 tps: 7157.28 qps: 7157.28 (r/w/o: 0.00/7157.28/0.00) lat (ms,95%): 244.38 err/s: 0.00 reconn/s: 0.00
[ 30s ] thds: 1000 tps: 7907.73 qps: 7907.73 (r/w/o: 0.00/7907.73/0.00) lat (ms,95%): 223.34 err/s: 0.00 reconn/s: 0.00
[ 35s ] thds: 1000 tps: 6915.58 qps: 6915.58 (r/w/o: 0.00/6915.58/0.00) lat (ms,95%): 287.38 err/s: 0.00 reconn/s: 0.00
[ 40s ] thds: 1000 tps: 7465.47 qps: 7465.47 (r/w/o: 0.00/7465.47/0.00) lat (ms,95%): 248.83 err/s: 0.00 reconn/s: 0.00
[ 45s ] thds: 1000 tps: 7681.82 qps: 7681.82 (r/w/o: 0.00/7681.82/0.00) lat (ms,95%): 215.44 err/s: 0.00 reconn/s: 0.00
[ 50s ] thds: 1000 tps: 7843.37 qps: 7843.37 (r/w/o: 0.00/7843.37/0.00) lat (ms,95%): 219.36 err/s: 0.00 reconn/s: 0.00
[ 55s ] thds: 1000 tps: 7438.48 qps: 7438.48 (r/w/o: 0.00/7438.48/0.00) lat (ms,95%): 227.40 err/s: 0.00 reconn/s: 0.00
[ 60s ] thds: 999 tps: 7428.62 qps: 7428.62 (r/w/o: 0.00/7428.62/0.00) lat (ms,95%): 244.38 err/s: 0.00 reconn/s: 0.00
SQL statistics:
    queries performed:
        read:                            0
        write:                           443082
        other:                           0
        total:                           443082
    transactions:                        443082 (7344.55 per sec.)
    queries:                             443082 (7344.55 per sec.)
    ignored errors:                      0      (0.00 per sec.)
    reconnects:                          0      (0.00 per sec.)

General statistics:
    total time:                          60.3262s
    total number of events:              443082

Latency (ms):
         min:                                    4.64
         avg:                                  135.70
         max:                                 1686.64
         95th percentile:                      244.38
         sum:                             60127946.27

Threads fairness:
    events (avg/stddev):           443.0820/6.81
execution time (avg/stddev):   60.1279/0.07
模拟3000客户端60S内持续写入
(已省略prepare阶段和cleanup阶段)
[root@nginx-001 mycat]# sysbench --threads=3000 --time=60 --report-interval=5 --db-driver=mysql --mysql-user=mycat --mysql-password=123456 --mysql-port=8066 --mysql-host=172.19.195.213 --mysql-db=db_mysqlslap oltp_insert run
sysbench 1.0.20 (using bundled LuaJIT 2.1.0-beta2)

Running the test with following options:
Number of threads: 3000
Report intermediate results every 5 second(s)
Initializing random number generator from current time


Initializing worker threads...

Threads started!

[ 5s ] thds: 3000 tps: 2665.02 qps: 2665.02 (r/w/o: 0.00/2665.02/0.00) lat (ms,95%): 1589.90 err/s: 0.00 reconn/s: 0.00
[ 10s ] thds: 3000 tps: 3490.28 qps: 3490.28 (r/w/o: 0.00/3490.28/0.00) lat (ms,95%): 1453.01 err/s: 0.00 reconn/s: 0.00
[ 15s ] thds: 3000 tps: 3230.34 qps: 3230.34 (r/w/o: 0.00/3230.34/0.00) lat (ms,95%): 1836.24 err/s: 0.00 reconn/s: 0.00
[ 20s ] thds: 3000 tps: 2632.61 qps: 2632.61 (r/w/o: 0.00/2632.61/0.00) lat (ms,95%): 1708.63 err/s: 0.00 reconn/s: 0.00
[ 25s ] thds: 3000 tps: 3553.00 qps: 3553.00 (r/w/o: 0.00/3553.00/0.00) lat (ms,95%): 1506.29 err/s: 0.00 reconn/s: 0.00
[ 30s ] thds: 3000 tps: 3589.01 qps: 3589.01 (r/w/o: 0.00/3589.01/0.00) lat (ms,95%): 1618.78 err/s: 0.00 reconn/s: 0.00
[ 35s ] thds: 3000 tps: 3119.60 qps: 3119.60 (r/w/o: 0.00/3119.60/0.00) lat (ms,95%): 1561.52 err/s: 0.00 reconn/s: 0.00
[ 40s ] thds: 3000 tps: 2879.60 qps: 2879.60 (r/w/o: 0.00/2879.60/0.00) lat (ms,95%): 1903.57 err/s: 0.00 reconn/s: 0.00
[ 45s ] thds: 3000 tps: 3465.99 qps: 3465.99 (r/w/o: 0.00/3465.99/0.00) lat (ms,95%): 1453.01 err/s: 0.00 reconn/s: 0.00
[ 50s ] thds: 3000 tps: 3159.60 qps: 3159.60 (r/w/o: 0.00/3159.60/0.00) lat (ms,95%): 1869.60 err/s: 0.00 reconn/s: 0.00
[ 55s ] thds: 3000 tps: 3085.61 qps: 3085.61 (r/w/o: 0.00/3085.61/0.00) lat (ms,95%): 1803.47 err/s: 0.00 reconn/s: 0.00
[ 60s ] thds: 3000 tps: 3683.64 qps: 3683.64 (r/w/o: 0.00/3683.64/0.00) lat (ms,95%): 1427.08 err/s: 0.00 reconn/s: 0.00
SQL statistics:
    queries performed:
        read:                            0
        write:                           195837
        other:                           0
        total:                           195837
    transactions:                        195837 (3221.25 per sec.)
    queries:                             195837 (3221.25 per sec.)
    ignored errors:                      0      (0.00 per sec.)
    reconnects:                          0      (0.00 per sec.)

General statistics:
    total time:                          60.7936s
    total number of events:              195837

Latency (ms):
         min:                                    5.95
         avg:                                  923.71
         max:                                 3793.72
         95th percentile:                     1618.78
         sum:                            180896402.46

Threads fairness:
    events (avg/stddev):           65.2790/2.81
execution time (avg/stddev):   60.2988/0.16
模拟6000客户端60S内持续写入
[root@nginx-001 mycat]# sysbench --threads=6000 --time=60 --report-interval=5 --db-driver=mysql --mysql-user=mycat --mysql-password=123456 --mysql-port=8066 --mysql-host=172.19.195.213 --mysql-db=db_mysqlslap oltp_insert prepare
sysbench 1.0.20 (using bundled LuaJIT 2.1.0-beta2)

Initializing worker threads...

Creating table 'sbtest1'...
Inserting 10000 records into 'sbtest1'
Creating a secondary index on 'sbtest1'...
[root@nginx-001 mycat]#
[root@nginx-001 mycat]#
[root@nginx-001 mycat]# sysbench --threads=6000 --time=60 --report-interval=5 --db-driver=mysql --mysql-user=mycat --mysql-password=123456 --mysql-port=8066 --mysql-host=172.19.195.213 --mysql-db=db_mysqlslap oltp_insert run
sysbench 1.0.20 (using bundled LuaJIT 2.1.0-beta2)

Running the test with following options:
Number of threads: 6000
Report intermediate results every 5 second(s)
Initializing random number generator from current time


Initializing worker threads...

Segmentation fault
[root@nginx-001 mycat]#
[root@nginx-001 mycat]# sysbench --threads=6000 --time=60 --report-interval=5 --db-driver=mysql --mysql-user=mycat --mysql-password=123456 --mysql-port=8066 --mysql-host=172.19.195.213 --mysql-db=db_mysqlslap oltp_insert cleanup
sysbench 1.0.20 (using bundled LuaJIT 2.1.0-beta2)

Dropping table 'sbtest1'...
模拟5000客户端60S内持续写入
(已省略prepare阶段和cleanup阶段)
[root@nginx-001 mycat]# sysbench --threads=5000 --time=60 --report-interval=5 --db-driver=mysql --mysql-user=mycat --mysql-password=123456 --mysql-port=8066 --mysql-host=172.19.195.213 --mysql-db=db_mysqlslap oltp_insert prepare
sysbench 1.0.20 (using bundled LuaJIT 2.1.0-beta2)

Initializing worker threads...

Creating table 'sbtest1'...
Inserting 10000 records into 'sbtest1'
Creating a secondary index on 'sbtest1'...
[root@nginx-001 mycat]# sysbench --threads=5000 --time=60 --report-interval=5 --db-driver=mysql --mysql-user=mycat --mysql-password=123456 --mysql-port=8066 --mysql-host=172.19.195.213 --mysql-db=db_mysqlslap oltp_insert run
sysbench 1.0.20 (using bundled LuaJIT 2.1.0-beta2)

Running the test with following options:
Number of threads: 5000
Report intermediate results every 5 second(s)
Initializing random number generator from current time


Initializing worker threads...

Threads started!

[ 5s ] thds: 5000 tps: 307.12 qps: 307.12 (r/w/o: 0.00/307.12/0.00) lat (ms,95%): 4768.67 err/s: 0.00 reconn/s: 0.00
[ 10s ] thds: 5000 tps: 1277.26 qps: 1277.26 (r/w/o: 0.00/1277.26/0.00) lat (ms,95%): 9118.47 err/s: 0.00 reconn/s: 0.00
[ 15s ] thds: 5000 tps: 1906.44 qps: 1906.44 (r/w/o: 0.00/1906.44/0.00) lat (ms,95%): 10917.50 err/s: 0.00 reconn/s: 0.00
[ 20s ] thds: 5000 tps: 1891.00 qps: 1891.00 (r/w/o: 0.00/1891.00/0.00) lat (ms,95%): 4517.90 err/s: 0.00 reconn/s: 0.00
[ 25s ] thds: 5000 tps: 1487.40 qps: 1487.40 (r/w/o: 0.00/1487.40/0.00) lat (ms,95%): 6135.91 err/s: 0.00 reconn/s: 0.00
[ 30s ] thds: 5000 tps: 2405.78 qps: 2405.78 (r/w/o: 0.00/2405.78/0.00) lat (ms,95%): 6026.41 err/s: 0.00 reconn/s: 0.00
[ 35s ] thds: 5000 tps: 1231.38 qps: 1231.38 (r/w/o: 0.00/1231.38/0.00) lat (ms,95%): 4517.90 err/s: 0.00 reconn/s: 0.00
[ 40s ] thds: 5000 tps: 2510.26 qps: 2510.26 (r/w/o: 0.00/2510.26/0.00) lat (ms,95%): 4055.23 err/s: 0.00 reconn/s: 0.00
[ 45s ] thds: 5000 tps: 1771.20 qps: 1771.20 (r/w/o: 0.00/1771.20/0.00) lat (ms,95%): 5217.92 err/s: 0.00 reconn/s: 0.00
[ 50s ] thds: 5000 tps: 1094.19 qps: 1094.19 (r/w/o: 0.00/1094.19/0.00) lat (ms,95%): 4943.53 err/s: 0.00 reconn/s: 0.00
[ 55s ] thds: 5000 tps: 2089.99 qps: 2089.99 (r/w/o: 0.00/2089.99/0.00) lat (ms,95%): 6026.41 err/s: 0.00 reconn/s: 0.00
[ 60s ] thds: 4999 tps: 2452.30 qps: 2452.30 (r/w/o: 0.00/2452.30/0.00) lat (ms,95%): 3326.55 err/s: 0.00 reconn/s: 0.00
SQL statistics:
    queries performed:
        read:                            0
        write:                           105753
        other:                           0
        total:                           105753
    transactions:                        105753 (1727.72 per sec.)
    queries:                             105753 (1727.72 per sec.)
    ignored errors:                      0      (0.00 per sec.)
    reconnects:                          0      (0.00 per sec.)

General statistics:
    total time:                          61.2075s
    total number of events:              105753

Latency (ms):
         min:                                    6.31
         avg:                                 2853.76
         max:                                13418.94
         95th percentile:                     6026.41
         sum:                            301793957.06

Threads fairness:
    events (avg/stddev):           21.1506/2.02
    execution time (avg/stddev):   60.3588/0.29
2、测试结果
以最后一次测试【模拟5000客户端60S内持续写入】为例;
在每隔5秒输出的信息中:
thds:并发数;
tps:接收、处理的tps数量(tps是一个完成的请求,即:客户端发送一个请求,后端处理并正确返回给客户端 是一个完整的tps)
qps:接收、处理的qps数量(qps代表的是服务端接收的能力,客户端发送一个请求,就是一个qps,或者说是一个查询请求;)
	#同时可以看到后面的 r/w/o ,对应着读、写、其他(update更新,或者读写混合类型),因为测试的是insert,所以所有请求都是w写入;
lat (ms,95%):
err/s:丢包 或者 数据库无法处理、处理不了;(tps小于qps时,说明有丢包或者无法处理;)
reconn/s:
SQL statistics:
read:0			#读请求总数
write:105753		#写入总数
other:0			#其他(update更新,或者读写混合类型)
total:105753		#总数
transactions:		#处理的事务数
queries:
ignored errors:		#丢包、处理不了的请求
reconnects:		#发起重新连接的请求(一般都有丢包、无法处理时才会发起)
General statistics:
total time: 实际测压时间;
total number of events:总的事务数;
Latency (ms):
min:	#处理单个事务最小时间;
avg:	#处理单个事务平均时间;
max:	#处理单个事务最大时间;
95th percentile:	#95%的语句的平均响应时间
sum:	#写入数据的总条数(可以查看测试库表中的数据量来验证;);
3、分析
测试的主要指标参数其实就是tps的处理时间和单位时间内处理的事务数。可以看到,并发数越大,tps越快,处理的总事务数也就越多;(tps在200毫秒只能算是一般,tps基本都应该在 200毫秒以内)
四次测试结果,可以看出,6000并发的时候,2核8G的配置已经无法处理了,cpu处理很慢,同时也出现了等待队列(可以自己打开xshell窗口用系统命令实时查看),内存资源不足;
差不多5000+并发就是极限;
不过生产环境中肯定是不能让数据库直接面对这么多并发的,而且实际环境也不可能就几千客户端;
四、优化方法
1、首先就是磁盘IO的优化,通过做raid磁盘阵列来提高IO,能大幅提高写入的性能;
2、提升系统的资源配置:cpu、内存;当IO足以高并发写入时,就需要cpu的处理速度了。cpu资源不足时,最多就是卡顿,但是内存不足可能会卡死,而且系统会在内存不足时随机杀死其他进程来释放内存资源,可能会杀死重要的服务进程!
3、系统参数和mysql服务的参数调优,比如最大连接数、连接断开时间、队列数等,当然,服务的参数是受制于系统的参数的,比如mysql开启了最大连接数为 1024,而系统内核的最大连接数为 1000,那数据库的最大连接数也就只能到1000了;
处理慢是因为cpu核数不够,也就是cpu资源不足,而5000+的并发瓶颈是因为内存不够。所以在优化这方面,服务还是基于系统的;
提升系统的资源,利用服务充分发挥系统能力才是优化的最终目的;