Prometheus监控mysql nginx tomcat 黑盒监控
部署consul_exporter,用与服务发现
https://github.com/prometheus/consul_exporter/releases/download/v0.9.0/consul_exporter-0.9.0.linux-amd64.tar.gz
注册
oot@ubuntu20:~# cat consul_export.json
root@ubuntu20:~# cat consul_export.json
{
  "services": [{
      "id": "consul_exporter",
      "name": "192.168.1.50_cousul_expo",
      "address": "192.168.1.50",
      "port": 9107,
      "tags": ["consul_exporter"],
      "checks": [{
        "http": "http://192.168.1.50:9107/metrics",
        "interval": "5s"
      }]
    }
  ]
consul services register consul_export.json
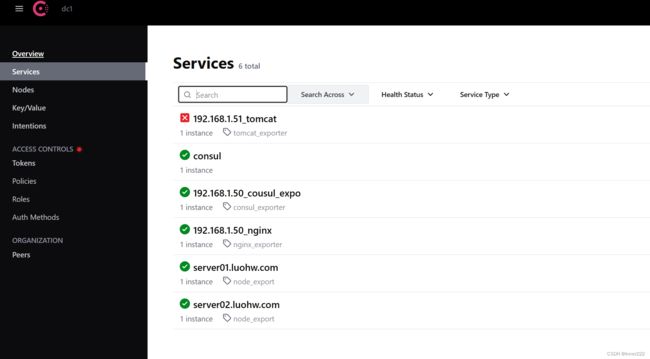
可以访问consul查看,
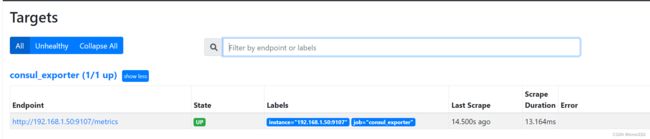
Prometheus添加配置
 - job_name: "consul_exporter"
    metrics_path: '/metrics'
    scheme: "http"
    consul_sd_configs:
        - server: "192.168.1.50:8500"
          tags:
          - "consul_exporter"
          refresh_interval: 1m
重新加载Prometheus
root@consumer:/apps/prometheus# curl -XPOST localhost:9090/-/reload
export 获取数据转换为Prometheus数据
pushgetway
查询持久化
grafanf绘图
altermanager 发送告警系统
选择
应用程序不兼容Prometheus
监控mysql
1.安装 mysqld export
$ cd /usr/local/src
$ wget https://github.com/prometheus/mysqld_exporter/releases/download/v0.12.1/mysqld_exporter-0.12.1.linux-amd64.tar.gz
$ tar -zxf mysqld_exporter-0.12.1.linux-amd64.tar.gz
$ mv mysqld_exporter-0.12.1.linux-amd64 /usr/local/mysqld_exporter
2.部署mysql
安装mysql
创建用户授权
create user ‘exporter’@‘%’ identified by ‘123456’;
GRANT PROCESS, REPLICATION CLIENT, SELECT ON . TO ‘exporter’@‘%’
3.启动服务
cd /usr/local/mysqld_exporter
创建配置文件,添加授权信息
vim .my.cnf
[client]
host=localhost
user=exporter
password=123456
创建service文件,使用systemd管理
cat > /usr/lib/systemd/system/mysqld_exporter.service <<EOF
[Unit]
Description=mysqld_exporter
After=network.target

[Service]
Type=simple
User=prometheus
ExecStart=/usr/local/mysqld_exporter/mysqld_exporter --config.my-cnf=/usr/local/mysqld_exporter/.my.cnf
Restart=on-failure

[Install]
WantedBy=multi-user.target
EOF
这里我也是用prometheus用户启动mysqld_exporter,所以要创建prometheus用户并授权。
$ groupadd prometheus
$ useradd -g prometheus -m -d /var/lib/prometheus -s /sbin/nologin prometheus
$ chown -R prometheus:prometheus /usr/local/mysqld_exporter
启动mysqld_exporter:
$ systemctl daemon-reload
$ systemctl start mysqld_exporter
$ systemctl status mysqld_exporter
$ systemctl enable mysqld_exporter
$ ss -tln | grep 9104
Prometheus配置中添加
  - job_name: "mysql"
    static_configs:
      - targets: ["192.168.1.73:9104"]
从新加载:curl -XPOST localhost:9090/-/reload
访问界面查看新增mysql
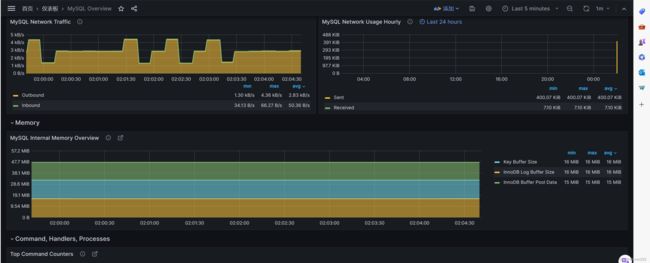
4.grafana中添加7362模版
nginx-export
https://github.com/nginxinc/nginx-prometheus-exporter
添加nginx配置,添加这个查看指标
       location /stub_status {
           # Turn on nginx stats
                stub_status on;
                access_log   off;
    # Only allow access from certain IP addresses
                allow all;
    #deny all;
                }
运行采集指标export
root@ubuntu20:/apps# ./nginx-prometheus-exporter -nginx.scrape-uri=http://192.168.1.50/stub_status
root@ubuntu20:/etc/nginx# netstat -antp |grep 9113
tcp6 0 0 :::9113 :: LISTEN 168719/./nginx-prom
root@ubuntu20:~# cat nginx_export.json
{
  "services": [{
      "id": "nginx_exporter",
      "name": "192.168.1.50_nginx",
      "address": "192.168.1.50",
      "port": 9113,
      "tags": ["nginx_exporter"],
      "checks": [{
        "http": "http://192.168.1.50:9113/metrics",
        "interval": "5s"
      }]
    }
  ]
}

consul services register  nginx_export.json
配置Prometheus添加
  - job_name: "nginx_exporter"
    metrics_path: '/metrics'
    scheme: "http"
    consul_sd_configs:
        - server: "192.168.1.50:8500"
          tags:
          - "nginx_exporter"
          refresh_interval: 1m
curl -XPOST localhost:9090/-/reload

监控tomcat
tomcat
mcat自身并不能提供监控指标数据,需要借助第三方exporter实现:https://github.com/nlighten/tomcat_exporter
JVM的export或者tomcat export
构建tomcat镜像,并暴露8082端口
cat docker-compose.yml
version: '3.6'

volumes:
    tomcat_webapps: {}

networks:
  monitoring:
    driver: bridge
    ipam:
      config:
        - subnet: 172.31.130.0/24

services:
  tomcat:
    #image: tomcat:jdk11
    build:
      context: tomcat
      dockerfile: Dockerfile
    hostname: tomcat.magedu.com
    expose:
      - 8080
    ports:
      - 8082:8080
    volumes:
      - tomcat_webapps:/usr/local/tomcat/webapps
      - ./tomcat/tomcat-users.xml:/usr/local/tomcat/conf/tomcat-users.xml
    networks:
      - monitoring
    environment:
      TZ: Asia/Shanghai
root@jenkins:~/learning-prometheus/08-prometheus-components-compose/tomcat-and-metrics# docker-compose up
注册到consul
root@ubuntu20:~# cat tomcat2.json
{
  "services": [{
      "id": "tomcat",
      "name": "192.168.1.51_tomcat",
      "address": "192.168.1.51",
      "port": 8082,
      "tags": ["tomcat_exporter"],
      "checks": [{
        "http": "http://192.168.1.51:8082/metrics",
        "interval": "5s"
      }]
    }
  ]
}


consul services register   tomcat2.json
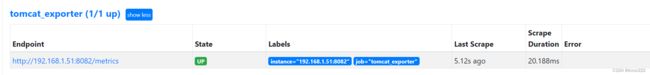
添加Prometheus配置并重新加载
  - job_name: "tomcat_exporter"
    metrics_path: '/metrics'
    scheme: "http"
    consul_sd_configs:
        - server: "192.168.1.50:8500"
          tags:
          - "tomcat_exporter"
          refresh_interval: 1m
curl -XPOST localhost:9090/-/reload
黑盒监控
https://github.com/prometheus/blackbox_exporter/releases/download/v0.24.0/blackbox_exporter-0.24.0.linux-amd64.tar.gz
通过容器运行
root@jenkins:~/learning-prometheus/08-prometheus-components-compose/blackbox-exporter# docker-compose up -d
Prometheus添加
  - job_name: "tomcat_exporter"
    metrics_path: '/metrics'
    scheme: "http"
    consul_sd_configs:
        - server: "192.168.1.50:8500"
          tags:
          - "tomcat_exporter"
          refresh_interval: 1m
  - job_name: 'blackbox'
    metrics_path: /probe
    params:
      module: [http_2xx]
    static_configs:
    - targets:
      - www.magedu.com
      - www.google.com
    relabel_configs:
      - source_labels: [__address__]
        target_label: __param_target
      - source_labels: [__param_target]
        target_label: instance
      - target_label: __address__
        replacement: "192.168.1.51:9115"  # Blackbox exporter.
      - target_label: region
        replacement: "remote"
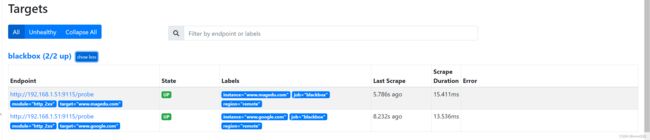
容器部署在9115端口页面显示失败
使用二进制部署参考https://blog.csdn.net/u011417723/article/details/120783567
正常
