echarts 甘特图
一、需求
用图表形式展示单个设备告警开始时间、结束时间、持续时长;以及告警类型、是否恢复等等
二、图
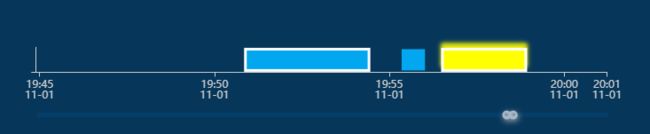
该图表示:
1、矩形首尾:告警开始、结束时间
2、矩形长度:告警持续时常
3、颜色:告警等级
4、白色边框:该告警是否为误告
5、模糊光圈:该告警是否恢复
三、代码
initChart=()=>{
        echarts.init(document.getElementById('profileChart')).dispose(); // 销毁实例
        let chart = echarts.init(document.getElementById('profileChart'))
        let detailList=JSON.parse(JSON.stringify(this.state.detailSource));
        //x轴时间
        let xArr=[]
        for(let i=0;i<detailList.length;i++){
            xArr.push(detailList[i].OccTime)
            xArr.push(this.calEndTime(detailList[i].OccTime,detailList[i].Period))
        }

        let minTime=xArr.length>0 && xArr[0].split(' ')[0]
        let maxTime=xArr.length>0 && moment(new Date(xArr[xArr.length-1]).getTime()+24*3600*1000).format('YYYY-MM-DD HH:mm:ss').split(' ')[0]
        //series中的data
        let sdata=[]
        for(let i=0;i<detailList.length;i++){
            sdata.push(
                {
                    itemStyle: {
                        normal: detailList[i].IsRestore?
                        {
                            color: almLvl[detailList[i].AlarmLevel].LevelColor,   //条形颜色
                            borderColor:"#fff",
                            borderWidth:detailList[i].IsFAlm?3:0,
                        }:
                        {
                            color: almLvl[detailList[i].AlarmLevel].LevelColor,   //条形颜色
                            borderColor:"#fff",
                            borderWidth:detailList[i].IsFAlm?3:0,
                            // opacity:detailList[i].IsRestore?1:0.6,
                            shadowColor:almLvl[detailList[i].AlarmLevel].LevelColor,
                            shadowBlur:5,
                            shadowOffsetY:-5
                        }
                    },
                    name: '',
                    value: [0, detailList[i].OccTime, this.calEndTime(detailList[i].OccTime,detailList[i].Period),detailList[i].Text]//第一位0,1,2代表y轴的索引,后两位代表x轴数据开始和结束,最后一位表示文本描述
                }
            )
        }
        console.log(xArr,sdata)
        chart.setOption({
            tooltip: {
                formatter: function (params) {
                    return params.value[3];
                }
            },
            dataZoom: [//缩放条
                {
                    type: 'slider',
                    filterMode: 'weakFilter',
                    showDataShadow: false,
                    top: 150,//距离顶部位置
                    height: 5,//缩放条粗细
                    borderColor: 'transparent',
                    backgroundColor: '#043e69',
                    handleIcon: 'M10.7,11.9H9.3c-4.9,0.3-8.8,4.4-8.8,9.4c0,5,3.9,9.1,8.8,9.4h1.3c4.9-0.3,8.8-4.4,8.8-9.4C19.5,16.3,15.6,12.2,10.7,11.9z M13.3,24.4H6.7v-1.2h6.6z M13.3,22H6.7v-1.2h6.6z M13.3,19.6H6.7v-1.2h6.6z', // jshint ignore:line
                    handleSize: 10,//手柄粗细
                    handleStyle: {
                        shadowBlur: 6,
                        shadowOffsetX: 1,
                        shadowOffsetY: 2,
                        shadowColor: '#aaa'
                    },
                    labelFormatter: ''
                },
                {
                    type: 'inside',
                    filterMode: 'weakFilter'
                }
            ],
            grid: {
                left: '10%',
                right: '10%',
                top: '40%',
                bottom: '10%',
                containLabel: true,
                height:60
            },
            xAxis: {
                type:'time',
                min: minTime,
                max: maxTime,
                axisLine:{
                    lineStyle:{
                        color:'#ccc'
                    }
                },
                axisTick:{
                    alignWithLabel:true
                },
                splitLine:{
                    show:false
                }
                // data:xArr//['2018-06-15','2018-06-25', '2018-07-01','2018-08-25','2018-11-14', '2018-12-13']
            },
            yAxis: {
                axisLine:{
                    lineStyle:{
                        color:'#ccc'
                    }
                },
                data:['']
            },
            series: [{
                type: 'custom',
                renderItem: function (params, api) {
                    var categoryIndex = api.value(0);
                    var start = api.coord([api.value(1), categoryIndex]);
                    var end = api.coord([api.value(2), categoryIndex]);
                    var height = 24;

                    return {
                        type: 'rect',
                        shape:echarts.graphic.clipRectByRect({// _that.$echarts.graphic.clipRectByRect({
                            x: start[0],
                            y: start[1] - height / 2,
                            width: end[0] - start[0],
                            height: height
                        },
                        {
                            x: params.coordSys.x,
                            y: params.coordSys.y,
                            width: params.coordSys.width,
                            height: params.coordSys.height
                        }),
                        style: api.style()
                    };
                },
                encode: {
                    x: [1, 2],
                    y: 0
                },
                data:sdata
            }]
        })
    }