Echarts画区域飞线地图
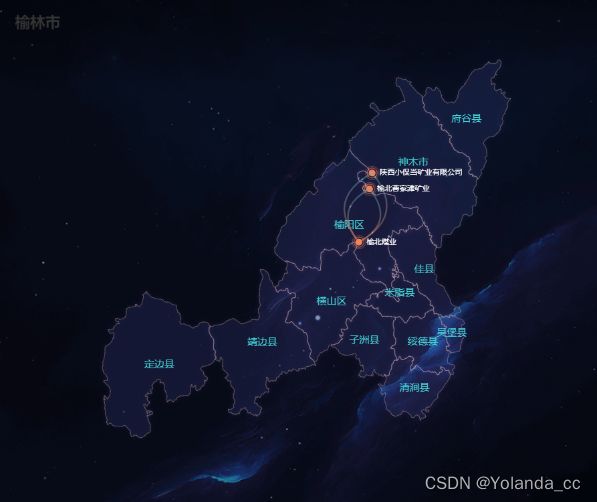
最近项目要求榆林市飞线图,地图上特定散点图加飞线效果,看效果:
1、echarts注册地图,如榆林市地图数据yls.json(https://geo.datav.aliyun.com/areas_v3/bound/610800_full.json)
import echarts from "echarts/lib/echarts";
import yls_json from "./yls.json";

let data = yls_json;
this.$echarts.registerMap("yls", data);
2、配置echarts的option的geo,将注册的地图yls放在echarts的geo中。series里的type:scatter设置coordinateSystem: 'geo';type: "lines",coordinateSystem: "geo",才能实现散点和飞线效果。
geo: {
        map: "yls",
        zoom: 1,
        label: {
          normal: {
            show: true,
            textStyle: {
              fontSize: 12,
              color: "#43D0D6",
            },
          },
          emphasis: {
            show: true,
          },
        },
        itemStyle: {
          normal: {
            borderColor: "rgba(255,209,163, .5)", //区域边框颜色
            areaColor: "rgba(73,86,166,.1)", //区域颜色
            borderWidth: 0.5, //区域边框宽度
            shadowBlur: 5,
            shadowColor: "rgba(107,91,237,.7)",
          },
          emphasis: {
            borderColor: "#FFD1A3",
            areaColor: "rgba(102,105,240,.3)",
            borderWidth: 1,
            shadowBlur: 5,
            shadowColor: "rgba(135,138,255,.5)",
          },
        },
      },
series: [
{
name: "地点",
type: "effectScatter",
coordinateSystem: "geo",
zlevel: 2,
rippleEffect: {
brushType: "stroke",
},
label: {
            normal: {
              show: true,
              formatter: "{b}",
              position: "right",
              textStyle: {
                color: "#fff",
                fontSize: 9,
              },
            },
          },
symbolSize: 8,
showEffectOn: "render",
itemStyle: {
normal: {
color: "#46bee9",
},
},
data: coord.slice(0, 3),
},
{
type: "lines",
coordinateSystem: "geo",
zlevel: 15,
effect: {
show: true,
constantSpeed: 30,
symbol: "pin",
symbolSize: 3,
trailLength: 0,
},
lineStyle: {
normal: {
color: new echarts.graphic.LinearGradient(
0,
0,
0,
1,
[
{
offset: 0,
color: "#58B3CC",
},
{
offset: 1,
color: "#F58158",
},
],
false
),
width: 2,
opacity: 0.4,
curveness: 0.6,
},
},
data: lines_coord.slice(0, 4),
},
],3、没有配置echarts的seriestype:scatter和type:lines,显示如下geo地图

4、地图上散点scatter显示label,使用echarts的formatter,达到最终效果
label: {
normal: {
show: true,
formatter: "{b}",
position: "right",
textStyle: {
color: "#fff",
fontSize: 9,
},
},
}, {a} — series的name值
{b} — 数据项的name值
{c} — 数据项的value值
完整代码: