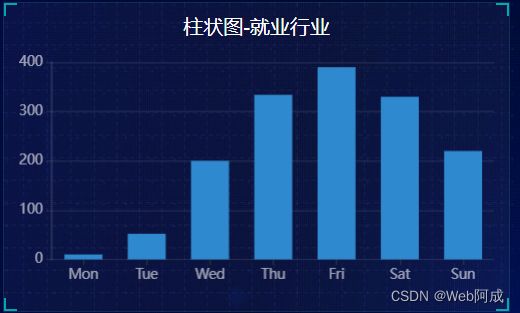
Echarts大屏可视化_03 定制柱状图
柱状图模块引入
1.找到合适的图表
在echarts中寻找与目标样式相近的图表
Examples - Apache ECharts
2. 引入柱状图
使用立即执行函数构建,防止变量全局污染
实例化对象 将官网中提供的option复制到代码中,并且构建图表
// 柱状图模块1
(function () {
  // 实例化对象
  var myChart = echarts.init(document.querySelector(".bar .chart"));
  // 指定配置项和数据
  var option = {
    tooltip: {
      trigger: "axis",
      axisPointer: {
        type: "shadow",
      },
    },
    grid: {
      left: "3%",
      right: "4%",
      bottom: "3%",
      containLabel: true,
    },
    xAxis: [
      {
        type: "category",
        data: ["Mon", "Tue", "Wed", "Thu", "Fri", "Sat", "Sun"],
        axisTick: {
          alignWithLabel: true,
        },
      },
    ],
    yAxis: [
      {
        type: "value",
      },
    ],
    series: [
      {
        name: "Direct",
        type: "bar",
        barWidth: "60%",
        data: [10, 52, 200, 334, 390, 330, 220],
      },
    ],
  };
  // 把配置项给实例对象
  myChart.setOption(option);
})();
代码中需要引入文件。
定制化开发柱状图
Echarts 配置手册
可以通过配置手册定制化开发Echarts
1.修改柱子颜色、x轴样式、y轴样式、图标大小
    //修改柱子颜色
    color: ["#2f89cf"],
    tooltip: {
      trigger: "axis",
      axisPointer: {
        type: "shadow",
      },
    },
    // 修改图标的大小
    grid: {
      left: "0%",
      top: "10px",
      right: "0%",
      bottom: "4%",
      containLabel: true,
    },
    // 修改x轴的相关配置
    xAxis: [
      {
        type: "category",
        data: ["Mon", "Tue", "Wed", "Thu", "Fri", "Sat", "Sun"],
        axisTick: {
          alignWithLabel: true,
        },
        // 修改刻度标签
        axisLabel: {
          color: "rgba(255, 255, 255, .6)",
          fontSize: "12",
        },
        // x轴样式不显示
        axisLine: {
          show: false,
        },
      },
    ],
    yAxis: [
      {
        type: "value",
        // 修改刻度标签
        axisLabel: {
          color: "rgba(255, 255, 255, .6)",
          fontSize: "12",
        },
        // x轴样式不显示
        axisLine: {
          // 设置单独的样式
          lineStyle: { color: "rgba(255, 255, 255, .1)", width: 2 },
        },
        // y轴分割线的颜色
        splitLine: {
          lineStyle: {
            color: "rgba(255, 255, 255, .1)",
          },
        },
      },
    ],
2. 柱子圆角、宽度
    series: [
      {
        name: "Direct",
        type: "bar",
        // 修改柱子宽度
        barWidth: "35%",
        data: [10, 52, 200, 334, 390, 330, 220],
        // 修改柱子圆角
        itemStyle: {
          barBorderRadius: 5,
        },
      },
    ],
3. 更换对应数据
    xAxis: [
      {
        type: "category",
        // 修改数据
        data: [
          "旅游行业",
          "教育培训",
          "游戏行业",
          "医疗行业",
          "电商行业",
          "社交行业",
          "金融行业",
        ],
        axisTick: {
          alignWithLabel: true,
        },
        // 修改刻度标签
        axisLabel: {
          color: "rgba(255, 255, 255, .6)",
          fontSize: "10",
        },
        // x轴样式不显示
        axisLine: {
          show: false,
        },
      },
    ],
series: [
      {
        name: "Direct",
        type: "bar",
        // 修改柱子宽度
        barWidth: "35%",
        // 修改数据  真正的开发 这些数据都是后端给的
        data: [200, 300, 300, 900, 1500, 1200, 600],
        // 修改柱子圆角
        itemStyle: {
          barBorderRadius: 5,
        },
      },
    ],
4.响应式设计
  // 侦听屏幕的变化,让图表跟着变化
  window.addEventListener("resize", function () {
    myChart.resize();
  });
问题解决
发现x轴部分标签因为宽度不够没有显示出来,这是echarts为了避免样式塌陷做的保护策略。我们可以让文字溢出隐藏。
     // 修改刻度标签
        axisLabel: {
          color: "rgba(255, 255, 255, .6)",
          fontSize: "10",
          //超出文字隐藏
          formatter: function (value) {
            if (value.length > 2) {
              return value.substr(0, 2) + "...";
            } else {
              return value;
            }
          },
        },


