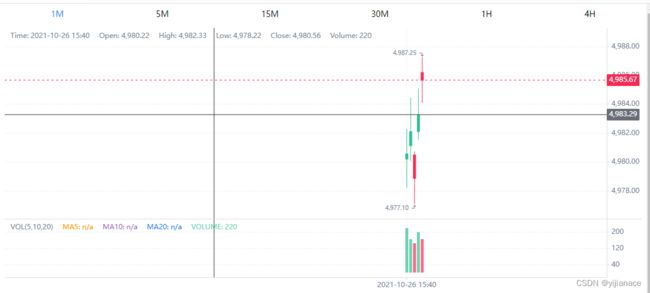
vue3+klinecharts实现k线(附完整代码)
vue3+klinecharts实现k线
-
-
- 环境
- 安装
- 图表配置
- 创建一个容器
- 实现点击时间切换图表
- 完整代码
-
环境
vue3 + klinecharts
安装
npm install klinecharts
图表配置
具体可用参考官网
https://klinecharts.com/guide/styles.html
const option = {
  crosshair: {
    show: true,
    // 十字光标水平线及文字
    horizontal: {
      show: true,
      line: {
        show: true,
        style: "solid",
        size: 1,
        color: "#333",
      },

    },
    vertical: {
      show: true,
      line: {
        show: true,
        style: 'solid',
        size: 1,
        color: '#333'
      },
  },
},
配置图表
chart.setStyles(option);
创建一个容器
<div id="chart_box" style="width: 100%; height: 450px"></div>
初始化图表
import { init} from "klinecharts";

const klineData = ref([...])

onMounted(() => {
  chart = init("chart_box");

  chart.setStyles(option);

  chart.createIndicator("VOL");

  chart.applyNewData(klineData.value[0].chart_data)
});
实现点击时间切换图表
	<div class="time">
      <span
        v-for="(item, index) in klineData"
        :key="index"
        @click="tabTime(item)"
        :class="item.time === active ? 'active' : ''"
        >{{ item.time }}</span
      >
    </div>

const active = ref("1M");

const tabTime = (item) => {
  active.value = item.time;
  chart.applyNewData(item.chart_data)
};
完整代码
<script setup>
import { onMounted, ref } from "vue";
import { init} from "klinecharts";

const active = ref("1M");

let chart;

const klineData = ref([
  {
    time: "1M",
    chart_data:[
  { "close": 4980.56, "high": 4982.33, "low": 4978.22, "open": 4980.22, "timestamp": 1635234000000, "volume": 220 },
  { "close": 4982.12, "high": 4984.45, "low": 4980.08, "open": 4981.15, "timestamp": 1635234060000, "volume": 165 },
  { "close": 4978.88, "high": 4980.75, "low": 4977.10, "open": 4980.50, "timestamp": 1635234120000, "volume": 145 },
  { "close": 4983.23, "high": 4985.12, "low": 4981.55, "open": 4982.10, "timestamp": 1635234180000, "volume": 200 },
  { "close": 4985.67, "high": 4987.25, "low": 4984.08, "open": 4986.22, "timestamp": 1635234240000, "volume": 165 },

]
  },
  {
    time: "5M",
    chart_data:[
  { "close": 4992.45, "high": 4994.12, "low": 4991.55, "open": 4991.88, "timestamp": 1635240000000, "volume": 190 },
  { "close": 4993.22, "high": 4995.10, "low": 4992.45, "open": 4992.55, "timestamp": 1635240060000, "volume": 225 },
  { "close": 4995.08, "high": 4996.55, "low": 4994.22, "open": 4994.88, "timestamp": 1635240120000, "volume": 160 },
  { "close": 4994.67, "high": 4996.22, "low": 4994.10, "open": 4995.22, "timestamp": 1635240180000, "volume": 155 },
  { "close": 4997.12, "high": 4998.45, "low": 4996.08, "open": 4996.55, "timestamp": 1635240240000, "volume": 200 },

]

  },
  {
    time: "15M",
    chart_data:[
    { "close": 4986.45, "high": 4988.10, "low": 4985.34, "open": 4986.98, "timestamp": 1635234300000, "volume": 198 },
  { "close": 4984.79, "high": 4987.55, "low": 4984.12, "open": 4985.22, "timestamp": 1635234360000, "volume": 225 },
  { "close": 4987.90, "high": 4989.25, "low": 4986.55, "open": 4987.10, "timestamp": 1635234420000, "volume": 210 },
  { "close": 4989.12, "high": 4991.20, "low": 4988.45, "open": 4989.55, "timestamp": 1635234480000, "volume": 215 },
  { "close": 4990.55, "high": 4992.34, "low": 4989.88, "open": 4990.12, "timestamp": 1635234540000, "volume": 230 }
    ]
  },
  {
    time: "30M",
    chart_data:[
    { "close": 4998.56, "high": 4999.25, "low": 4997.45, "open": 4997.90, "timestamp": 1635240300000, "volume": 220 },
  { "close": 4998.22, "high": 5000.10, "low": 4998.12, "open": 4998.45, "timestamp": 1635240360000, "volume": 215 },
  { "close": 5000.10, "high": 5001.22, "low": 4999.55, "open": 5000.00, "timestamp": 1635240420000, "volume": 210 },
  { "close": 4999.88, "high": 5001.55, "low": 4999.22, "open": 5000.45, "timestamp": 1635240480000, "volume": 225 },
  { "close": 5001.34, "high": 5002.45, "low": 5000.88, "open": 5001.22, "timestamp": 1635240540000, "volume": 230 }
    ]
  },
  {
    time: "1H",
    chart_data:[
    { "close": 5003.68, "high": 5004.42, "low": 5002.95, "open": 5003.00, "timestamp": 1635240600000, "volume": 220 },
    { "close": 5004.10, "high": 5005.28, "low": 5003.75, "open": 5003.80, "timestamp": 1635240660000, "volume": 215 },
    { "close": 5005.22, "high": 5006.15, "low": 5004.88, "open": 5005.00, "timestamp": 1635240720000, "volume": 210 },
    { "close": 5004.78, "high": 5006.22, "low": 5004.05, "open": 5005.22, "timestamp": 1635240780000, "volume": 225 },
    { "close": 5006.02, "high": 5007.45, "low": 5005.88, "open": 5006.10, "timestamp": 1635240840000, "volume": 230 }
    ]
  },
  {
    time: "4H",
    chart_data:[
    { "close": 5006.45, "high": 5007.90, "low": 5005.75, "open": 5006.68, "timestamp": 1635240900000, "volume": 220 },
    { "close": 5006.88, "high": 5008.22, "low": 5006.45, "open": 5007.00, "timestamp": 1635240960000, "volume": 215 },
    { "close": 5007.15, "high": 5008.50, "low": 5007.00, "open": 5007.25, "timestamp": 1635241020000, "volume": 210 },
  { "close": 4999.88, "high": 5001.55, "low": 4999.22, "open": 5000.45, "timestamp": 1635240480000, "volume": 225 },
  { "close": 5007.88, "high": 5009.10, "low": 5007.55, "open": 5007.95, "timestamp": 1635241140000, "volume": 230 }
    ]
  },
]);

const option = {
  crosshair: {
    show: true,
    // 十字光标水平线及文字
    horizontal: {
      show: true,
      line: {
        show: true,
        style: "solid",
        size: 1,
        color: "#333",
      },

    },
    vertical: {
      show: true,
      line: {
        show: true,
        style: 'solid',
        size: 1,
        color: '#333'
      },
  },
},


};

onMounted(() => {
  chart = init("chart_box");

  chart.setStyles(option);

  chart.createIndicator("VOL");

  chart.applyNewData(klineData.value[0].chart_data)
});

const tabTime = (item) => {
  active.value = item.time;
  chart.applyNewData(item.chart_data)
};
</script>

<template>
  <div class="charts">
    <div class="time">
      <span
        v-for="(item, index) in klineData"
        :key="index"
        @click="tabTime(item)"
        :class="item.time === active ? 'active' : ''"
        >{{ item.time }}</span
      >
    </div>
    <div id="chart_box" style="width: 100%; height: 450px"></div>
  </div>
</template>

<style lang="scss" scoped>
.charts {
  width: auto;
  height: 100vh;
  .time {
    display: flex;
    justify-content: space-around;
    font-size: 14px;
    .active {
      color: #1a89ee;
    }
  }
  #chart_box {
    margin: 15px 0px;
  }
}
</style>

