记录一次chatGPT人机协同实战辅助科研——根据词库自动进行情感分析
有一个Excel中的一列,读取文本判断文本包含积极情感词.txt和消极情感词.txt的个数,分别生成两列统计数据
请将 ‘your_file.xlsx’ 替换为你的Excel文件名,'Your Text Column’替换为包含文本的列名。
这个程序首先读取了积极和消极情感词,并定义了两个函数来统计文本中这些词的数量。然后,它使用这两个函数来创建新的列,并将结果保存为一个新的Excel文件。
# -*- coding:utf-8 -*-f
import pandas as pd

# 读入数据

# 读取Excel文件
file_path = 'chatGPT_analyse_result.xlsx'
df = pd.read_excel(file_path)

# 定义函数来统计文本中出现的词汇数
def count_words(text, word_list):
    count = 0
    for word in word_list:
        if word in text:
            count += 1
    return count

# 读取积极和消极情绪词文件
positive_words_path = '积极情绪词库.txt'  # 请替换为你的积极情绪词文件路径
negative_words_path = '消极情绪词库.txt'  # 请替换为你的消极情绪词文件路径

# 读取积极和消极情绪词文件内容到列表中
with open(positive_words_path, 'r', encoding='utf-8') as file:
    positive_words = [line.strip() for line in file]

with open(negative_words_path, 'r', encoding='utf-8') as file:
    negative_words = [line.strip() for line in file]

# 对每一行文本进行积极和消极情绪词的统计
positive_counts = []
negative_counts = []

for text in df['分析结果']:
    positive_count = count_words(str(text), positive_words)
    negative_count = count_words(str(text), negative_words)
    positive_counts.append(positive_count)
    negative_counts.append(negative_count)

# 将统计结果添加到数据框中
df['积极情绪词个数'] = positive_counts
df['消极情绪词个数'] = negative_counts

# 将结果保存到新的Excel文件中
output_file_path = '分析结果.xlsx'
df.to_excel(output_file_path, index=False)

print("已生成带有情绪词统计的Excel文件。")
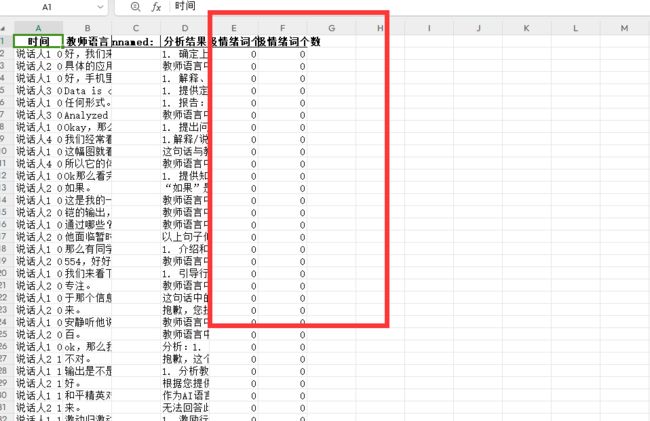
发现次数都是0
调整prompt
还是不匹配 ,接续追问
# -*- coding:utf-8 -*-f
import pandas as pd
import jieba
# 读入数据

# 读取Excel文件
file_path = 'chatGPT_analyse_result.xlsx'
df = pd.read_excel(file_path)

# 情绪词列表
positive_words = ['透露', '亲切', '容忍', '听从', '被动', '创新', '发表', '好的', '鼓舞', '赋予', '喜欢', '配合', '聪明', '偏向', '交流', '合理', '猜测', '夸奖', '致力于', '称赞', '不错', '听懂', '安慰', '善于', '爱', '提升', '坚持', '看好', '指引', '劝慰', '舒缓', '减轻', '推导', '愉快', '轻松', '沟通', '有序', '进步', '谢谢', '强烈', '懂', '恰当', '持之以恒', '至关重要', '振奋', '赞成', '妥当', '礼貌', '温暖', '有利于']

negative_words = ['批评', '不对', '抱歉', '薄弱', '不适', '不足', '谴责', '逼迫', '厌烦', '不行', '指责', '负面', '惩罚', '紧张', '责备', '告诫', '挫败', '气馁', '紧迫', '质疑', '不满', '贬低', '忽视', '批判', '疑惑', '反对', '不是', '失败', '催促', '担心', '无礼', '失去', '焦虑', '着急', '退步', '模糊', '放弃', '迷惘', '灰心丧气', '批判性', '禁止', '不当', '犯错', '忽略', '拒绝', '担忧', '不专业', '困难']

# 分词函数
def tokenize(text):
    return jieba.lcut(text)

# 对每一行文本进行分词和积极、消极情绪词的统计
positive_counts = []
negative_counts = []

for text in df['分析结果']:
    words = tokenize(str(text))  # 分词
    positive_count = any(word in positive_words for word in words)
    negative_count = any(word in negative_words for word in words)
    positive_counts.append(1 if positive_count else 0)
    negative_counts.append(1 if negative_count else 0)

# 将统计结果添加到数据框中
df['积极情绪词个数'] = positive_counts
df['消极情绪词个数'] = negative_counts

# 将结果保存到新的Excel文件中
output_file_path = '分析结果.xlsx'
df.to_excel(output_file_path, index=False)

print("已生成带有情绪词统计的Excel文件。")
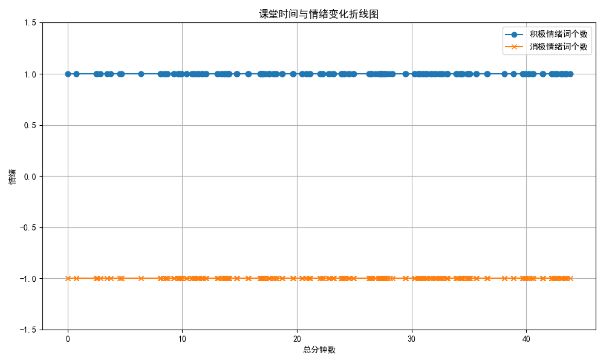
最后在画个图
转换成分钟
import pandas as pd

# 读取Excel文件
file_path = 'chatGPT_analyse_result.xlsx'  # 请替换为你的Excel文件路径
df = pd.read_excel(file_path)

# 提取时间列中的分钟和秒钟数据
time_pattern = r'(\d+):(\d+)'
df['分钟'] = df['时间'].str.extract(time_pattern)[0].astype(int) * 60  # 提取分钟并转换为秒钟
df['秒钟'] = df['时间'].str.extract(time_pattern)[1].astype(int)

# 计算总的秒钟数
df['总秒钟数'] = df['分钟'] + df['秒钟']

# 将总秒钟数转换回分钟
df['总分钟数'] = df['总秒钟数'] / 60

# 打印结果或保存到新的Excel文件中
print(df[['分钟', '秒钟', '总秒钟数', '总分钟数']])  # 打印结果
# 或者保存到新的Excel文件中
output_file_path = '处理后的结果.xlsx'

df.to_excel(output_file_path, index=False)
print('ok')
import pandas as pd
import matplotlib.pyplot as plt
plt.rcParams['font.sans-serif']=['SimHei']
plt.rcParams['axes.unicode_minus']=False

# 读取Excel文件
file_path = '分析结果.xlsx'  # 请替换为你的Excel文件路径
df = pd.read_excel(file_path)

# 映射积极情绪词个数和消极情绪词个数到1和-1
df['积极情绪映射'] = df['积极情绪词个数'].apply(lambda x: 1)
df['消极情绪映射'] = df['消极情绪词个数'].apply(lambda x: -1)

# 绘制折线图
plt.figure(figsize=(10, 6))  # 设置图形大小

# 以总分钟数为 x 轴,积极情绪映射和消极情绪映射为 y 轴绘制折线图
plt.plot(df['总分钟数'], df['积极情绪映射'], label='积极情绪词个数', marker='o')  # marker='o' 表示使用圆点标记数据点
plt.plot(df['总分钟数'], df['消极情绪映射'], label='消极情绪词个数', marker='x')  # marker='x' 表示使用X标记数据点

plt.xlabel('总分钟数')  # x 轴标签
plt.ylabel('情绪')  # y 轴标签
plt.title('课堂时间与情绪变化折线图')  # 图表标题

plt.legend()  # 显示图例
plt.grid(True)  # 显示网格线

plt.ylim(-1.5, 1.5)  # 设置 y 轴显示范围

plt.tight_layout()  # 调整布局使标签等不会被裁剪
plt.show()  # 显示图形


