vue 使用 Echarts做地图及飞线效果
前言:
效果图

一. 项目中安装以及引入Echarts
1.1 npm 命令安装echarts库
npm install echarts --save1.2 yarn命令安装echarts库
yarn add echarts1.3 引用
a. 在使用页面上引入 在Vue组件的script标签中引入echarts库
使用 echarts
import * as echarts from "echarts";b. 全局引用 在main.js中引入echarts库
使用 this.$echarts
import echarts from 'echarts';
Vue.use(echarts);
Vue.prototype.$echarts = echarts;
二. 创建Echarts地图
1. echarts展示的盒子
Echarts父盒子有多大 Echarts就展示多大。
2. 引入地图数据
import testjson from "./../../utils/bj.json";这个地图数据是北京市各个区边界数据。下载地址:https://datav.aliyun.com/portal/school/atlas/area_selector
这地址我们可以下载自己所想要的地图边界数据。或者是找公司给我边界数据。格式必须跟这个一样。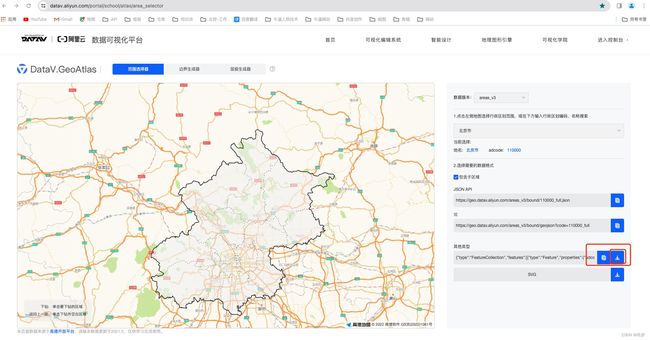
把上面的数据下载下来 并引入我们就可以使用。
3. 飞线数据以及方法
sjfbEcharts: null,        // echarts实例

// 图片是base64也行
planePath:
                "path://M1705.06,1318.313v-89.254l-319.9-221.799l0.073-208.063c0.521-84.662-26.629-121.796-63.961-121.491c-37.332-0.305-64.482,36.829-63.961,121.491l0.073,208.063l-319.9,221.799v89.254l330.343-157.288l12.238,241.308l-134.449,92.931l0.531,42.034l175.125-42.917l175.125,42.917l0.531-42.034l-134.449-92.931l12.238-241.308L1705.06,1318.313z",
linesData: [
    {
        fromName: '西城区',        // 飞线起始位置
        toName: '海淀区',          // 飞线结束位置
        coords: [
              [116.36567, 39.912028],    // 飞线起始位置
              [116.23328, 40.026927]     // 飞线结束位置
        ],
        value: 100
     },
     {
          fromName: '怀柔区',
          toName: '海淀区',
          coords: [
               [116.586079, 40.63069],
               [116.23328, 40.026927]
          ],
           value: 100
      },
],
mounted() {
this.initMapEcharts();
},
initMapEcharts() {
let zhenjie = "海淀区"; // 自己命名
let data = testjson.features;
let mapList = testjson;
// 获取echarts盒子并初始化
this.sjfbEcharts = this.$echarts.init(document.getElementById("linesecharts"));
this.$echarts.registerMap(zhenjie, mapList);
let options = {
geo: {
type: "map",
map: zhenjie, //chinaMap需要与registerMao中的变量名称保持一致
raom: false,
itemStyle: {
normal: {
areaColor: "rgb(4,46,84)",
borderColor: "#fff",
},
emphasis: {
areaColor: "#389bb7", //鼠标指上市时的颜色
},
},
label: {
normal: {
position: "bottom",
show: true, //不显示
textStyle: {
// 地图上散点的字体样式
fontSize: 16,
fontWeight: "400",
color: "#fff", // 点上字的颜色
},
},
emphasis: {
show: true,
},
},
},
series: [
// 地图配置
{
name: "海淀区信息",
type: "map",
map: zhenjie,
label: {
show: true, //是否显示市
normal: {
textStyle: {
fontSize: 12,
fontWeight: "bold",
color: "#fff",
},
},
},
zoom: 1.2,
data: data,
itemStyle: {
normal: {
label: { show: true },
color: "#F4F4F4",
areaColor: "#1E62AC",
borderColor: "#53D9FF",
borderWidth: 1.3,
shadowBlur: 15,
shadowColor: "rgb(58,115,192)",
shadowOffsetX: 4,
shadowOffsetY: 4,
},
// 鼠标移入地区的样式
emphasis: {
label: { show: true, color: "#fff" },
borderWidth: 3,
borderColor: "#1eccc6",
areaColor: "#07b4af",
shadowColor: "#1eccc6",
shadowBlur: 15,
},
},
},
// 飞线配置
{
type: "lines",
zlevel: 2,
effect: {
show: true,
period: 5, // 箭头指向速度,值越小速度越快
trailLength: 0, // 特效尾迹长度[0,1]值越大,尾迹越长重
symbol: this.planePath, // 飞机图标
symbolSize: 15, // 图标大小
color: "#01AAED",
},
// 可以配置自己的飞线图标
// effect: {
// show: true,
// period: 5, // 箭头指向速度,值越小速度越快
// trailLength: 0, // 特效尾迹长度[0,1]值越大,尾迹越长重
// symbol: this.planePath, // 飞机图标
// symbolSize: 15, // 图标大小
// color: "#01AAED",
// },
lineStyle: {
normal: {
width: 0.8, // 尾迹线条宽度
opacity: 1, // 尾迹线条透明度
curveness: 0.3, // 尾迹线条曲直度
},
},
data: this.linesData,
},
],
};
this.sjfbEcharts.setOption(options);
setTimeout(() => {
window.addEventListener("resize", () => this.sjfbEcharts.resize());
}, 0);
},三. 完整代码