python画折线图
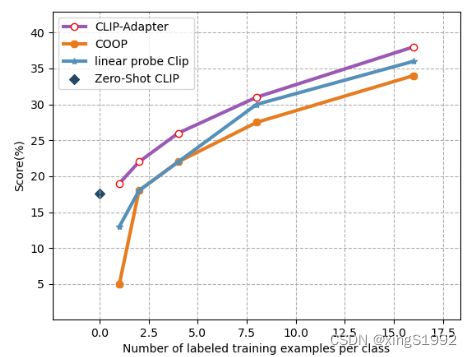
最近要画论文中的图,参考了一下之前的论文里面的图,觉得人家画的不错(见下图),想画一下,但是一直也没找到合适的画法,最近潜心研究,终于解决了这个问题,写一下,供大家参考

乍一看,这个图挺唬人的,因为它横坐标有17个(0-16)点,但是仔细看看,就会发现中间的点都是跳跃连接的,根本没有点,有点的地方只是0,1,2,4,8,16.而且0点上只有一个点,所以怎么跳跃过去还得让它把横坐标的数字均匀的显示出来是个问题,我找了很多博客,结果最后不能跳跃连接,而且0那个点不显示。实在是苦恼了我很久,今天终于看到一本书解决了这个问题,记录下来,供大家参考。话不多说,上代码:
import matplotlib.pyplot as plt


styles = plt.style.available
CLIP_Adapter = [19, 22, 26, 31, 38]
COOP = [5, 18, 22, 27.5, 34]
linear_Clip = [13, 18, 22, 30, 36]
input_values = [1, 2, 4, 8, 16]
fig, ax = plt.subplots()
ax.plot(input_values, CLIP_Adapter, linewidth=3, marker='o', mec='r', mfc='w', label='CLIP-Adapter', color='#9B59B6')
ax.plot(input_values, COOP, linewidth=3, marker='8',  label='COOP', color='#E67C1F')
ax.plot(input_values, linear_Clip, linewidth=3, marker='*', label='linear probe Clip', color='#5490B9')
plt.scatter(0, 17.55, marker='D', label='Zero-Shot CLIP', color='#204969')
plt.subplots_adjust(bottom=0.10)
# 设置背景颜色
plt.rcParams['axes.facecolor'] = 'white'
# 设置背景线条样式
plt.grid(linestyle='--')
plt.xlabel('Number of labeled training examples per class')  # X轴标签
plt.ylabel("Score(%)")  # Y轴标签
plt.margins(0.15)
plt.legend()
# plt.savefig("FGVCAircraft.jpg")
fig.show()
