探索Python中的图像处理库:打开视觉世界的大门
导读:简述图像处理在各行各业中的应用,介绍图像处理对于项目如机器学习、数据分析、艺术创作等的重要应用。
目录
Pillow - 基础图像处理库
安装
图像的基本操作
读取图像
显示图像
编辑图像转换
编辑
保存图像
编辑
图像裁剪、调整大小
编辑编辑
OpenCV - 高级图像处理和计算机视觉
安装
主要特性功能
读取和显示图像
面部识别
步骤
结果
图像滤镜
Matplotlib - 数据可视化和图像展示
安装命令
使用Matplotlib显示图像
数据可视化
条形图
散点图
直方图
饼图
其他库和框架
SciPy和NumPy
概述
应用
使用NumPy进行图像操作
丑八怪~~~~~~~
scikit-image
简介
特点
使用scikit-image进行边缘检测
Pillow - 基础图像处理库
Pillow是Python Imaging Library (PIL)的一个活跃分支和替代品。作为一个强大的图像处理库,Pillow支持广泛的文件格式,并提供了各种图像处理功能。
安装
pip install Pillow
图像的基本操作
Pillow的主要功能包括图像的读取、处理和保存。
读取图像
使用Pillow打开图像文件非常直观,如下所示:
from PIL import Image

# 打开图像文件
img = Image.open("path/to/image.jpg")
显示图像
Pillow可以配合使用Python的标准GUI库来显示图像:
img.show()
 图像转换
图像转换
你可以对图像进行各种转换,例如调整大小、旋转和颜色转换等。
# 转换为灰度图像
img_gray = img.convert('L')
img_gray.show()
保存图像
修改后的图像可以轻松保存到文件系统中:
img_gray.save("gray_image.jpg")
图像裁剪、调整大小
Pillow提供了一系列图像处理功能,包括但不限于裁剪、调整尺寸、图像滤镜等。大家可以自行尝试。
# 裁剪图像
box = (100, 100, 400, 400)
cropped_image = img.crop(box)
cropped_image.show()


# 调整图像尺寸
new_size = (200, 200)
resized_image = img.resize(new_size)
resized_image.show()
OpenCV - 高级图像处理和计算机视觉
OpenCV(Open Source Computer Vision Library)是一个开源的计算机视觉和机器学习软件库。它为处理图像和视频提供了强大的工具,包括面部识别、物体检测、图像滤镜等高级功能。
安装
pip install opencv-python
主要特性功能
读取和显示图像
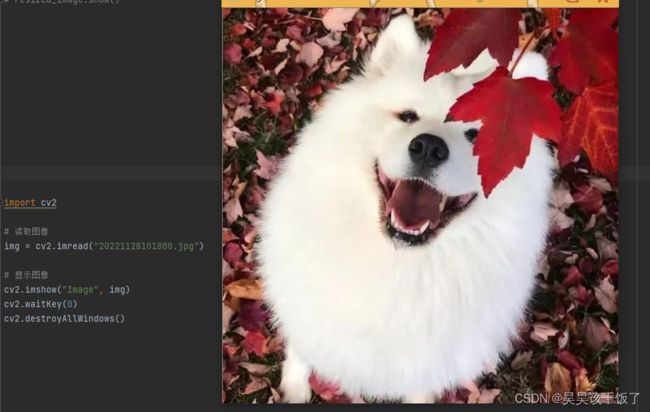
使用OpenCV读取和显示图像:
import cv2

# 读取图像
img = cv2.imread("path/to/image.jpg")

# 显示图像
cv2.imshow("Image", img)
cv2.waitKey(0)
cv2.destroyAllWindows()
面部识别
OpenCV支持多种面部识别算法,可以用于识别照片或视频中的人脸。
import cv2

# 加载Haar级联面部识别分类器
face_cascade = cv2.CascadeClassifier(cv2.data.haarcascades + 'haarcascade_frontalface_default.xml')

# 读取图像
img = cv2.imread("image.jpg")

# 转换为灰度图像,因为Haar级联分类器需要灰度图像
gray = cv2.cvtColor(img, cv2.COLOR_BGR2GRAY)

# 检测图像中的脸部
faces = face_cascade.detectMultiScale(gray, scaleFactor=1.1, minNeighbors=4)

# 为每个检测到的脸部画一个矩形框
for (x, y, w, h) in faces:
    cv2.rectangle(img, (x, y), (x+w, y+h), (255, 0, 0), 2)

# 显示带有面部识别的图像
cv2.imshow('Face Detected', img)
cv2.waitKey()
步骤
- 使用
cv2.CascadeClassifier加载OpenCV的Haar级联分类器。 - 图像被读取并转换为灰度图像,因为面部识别通常在灰度图上进行。
- 使用
detectMultiScale方法检测图像中的脸部。 - 对于检测到的每个脸部,绘制一个矩形框。
结果
图像滤镜
OpenCV提供了丰富的图像滤镜,如模糊、边缘检测等
# 应用高斯模糊
blurred_img = cv2.GaussianBlur(img, (5, 5), 0)
cv2.imshow("Blurred Image", blurred_img)
能看出来区别吗?
Matplotlib - 数据可视化和图像展示
Matplotlib是一个广泛使用的Python绘图库,它提供了一个类似MATLAB的绘图系统。Matplotlib非常适合用于生成各种静态、动态和交互式的图表。
安装命令
pip install matplotlib
使用Matplotlib显示图像
import matplotlib.pyplot as plt
import matplotlib.image as mpimg

# 读取图像
img = mpimg.imread('path/to/your/image.jpg')

# 显示图像
plt.imshow(img)
plt.axis('off')  # 不显示坐标轴
plt.show()
数据可视化
Matplotlib的主要强项在于其数据可视化能力。它可以用来创建线图、条形图、散点图、直方图等多种图表。
条形图
条形图通常用于比较不同类别间的数量差异。
import matplotlib.pyplot as plt

# 数据
categories = ['Category A', 'Category B', 'Category C']
values = [5, 3, 8]

plt.bar(categories, values)
plt.title('Bar Chart Example')
plt.xlabel('Categories')
plt.ylabel('Values')
plt.show()
散点图
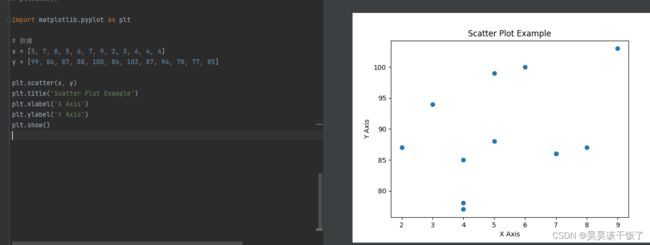
散点图用于展示两个变量之间的关系。
import matplotlib.pyplot as plt

# 数据
x = [5, 7, 8, 5, 6, 7, 9, 2, 3, 4, 4, 4]
y = [99, 86, 87, 88, 100, 86, 103, 87, 94, 78, 77, 85]

plt.scatter(x, y)
plt.title('Scatter Plot Example')
plt.xlabel('X Axis')
plt.ylabel('Y Axis')
plt.show()
直方图
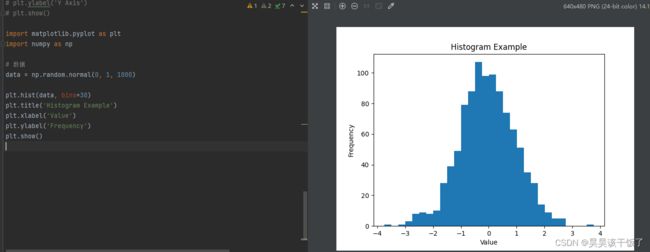
直方图用于展示数据分布的情况。
import matplotlib.pyplot as plt
import numpy as np

# 数据
data = np.random.normal(0, 1, 1000)

plt.hist(data, bins=30)
plt.title('Histogram Example')
plt.xlabel('Value')
plt.ylabel('Frequency')
plt.show()
饼图
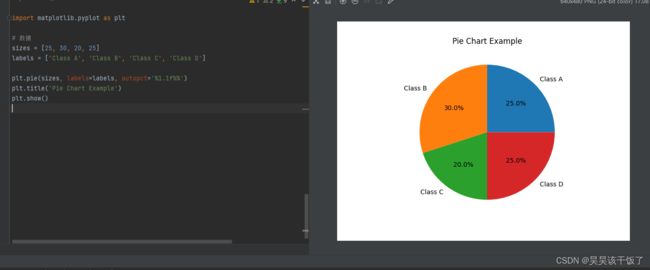
饼图用于展示每个类别相对于总量的比例。
import matplotlib.pyplot as plt

# 数据
sizes = [25, 30, 20, 25]
labels = ['Class A', 'Class B', 'Class C', 'Class D']

plt.pie(sizes, labels=labels, autopct='%1.1f%%')
plt.title('Pie Chart Example')
plt.show()
其他库和框架
除了Pillow、OpenCV和Matplotlib,Python还提供了其他一些强大的库和框架,用于图像处理和分析。这些工具各有特色,适用于不同的应用场景。
SciPy和NumPy
概述
SciPy和NumPy是科学计算的核心库,它们为图像处理提供了强大的数学背景。
应用
这些库主要用于图像的低级操作,如图像的数学变换、滤波和其他算法实现。
使用NumPy进行图像操作
import numpy as np
from PIL import Image

# 加载图像,并转换为NumPy数组
img = Image.open('path/to/image.jpg')
img_array = np.array(img)

# 执行一些操作,例如反转颜色
inverted_img_array = 255 - img_array

# 将NumPy数组转回为图像
inverted_img = Image.fromarray(inverted_img_array)
inverted_img.show()
丑八怪~~~~~~~
scikit-image
简介
scikit-image是建立在SciPy之上的图像处理库,提供了更多高级的图像处理功能。
特点
它包括图像分割、几何变换、颜色空间操作等复杂的图像处理算法。
使用scikit-image进行边缘检测
from skimage import filters, io, color

# 读取图像
img = io.imread('path/to/image.jpg')
img_gray = color.rgb2gray(img)

# 应用Sobel滤波器进行边缘检测
edges = filters.sobel(img_gray)
io.imshow(edges)
io.show()
----------------
以上 觉得有趣欢迎点赞收藏~ 欢迎评论区交流~


