Pytorch常用的函数(五)np.meshgrid()和torch.meshgrid()函数解析
Pytorch常用的函数(五)np.meshgrid()和torch.meshgrid()函数解析
我们知道torch.meshgrid()函数的功能是生成网格,可以用于生成坐标;
在numpy中也有一样的函数np.meshgrid(),但是用法不太一样,我们直接上代码进行解释。
1、两者在用法上的区别
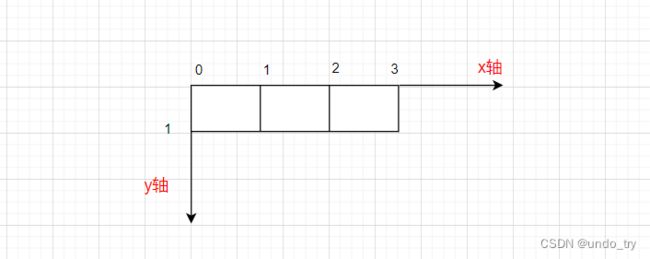
比如:我要生成下图的xy坐标点,看下两者的实现方式:
np.meshgrid()
>>> import numpy as np
>>> w, h = 4, 2
# 注意,此时输入的是由w和h生成的一维数组
#      此时输出的是网格x的坐标grid_x以及网格y的坐标grid_y
>>> grid_x, grid_y  = np.meshgrid(np.arange(w), np.arange(h))

>>> grid_x
array([[0, 1, 2, 3],
       [0, 1, 2, 3]])
>>> grid_y
array([[0, 0, 0, 0],
       [1, 1, 1, 1]])
torch.meshgrid()
>>> import torch
# 注意,此时输入的是由h和w生成的一维数组(和numpy中的输入顺序相反)
#      此时输出的是网格y的坐标grid_y以及网格x的坐标grid_x(和numpy中的输出顺序相反)
>>> grid_y, grid_x =  torch.meshgrid(
...         torch.arange(h),
...         torch.arange(w)
...     )
>>> grid_x
tensor([[0, 1, 2, 3],
        [0, 1, 2, 3]])
>>> grid_y
tensor([[0, 0, 0, 0],
        [1, 1, 1, 1]])
2、应用案例
2.1 利用np.meshgrid()来画决策边界
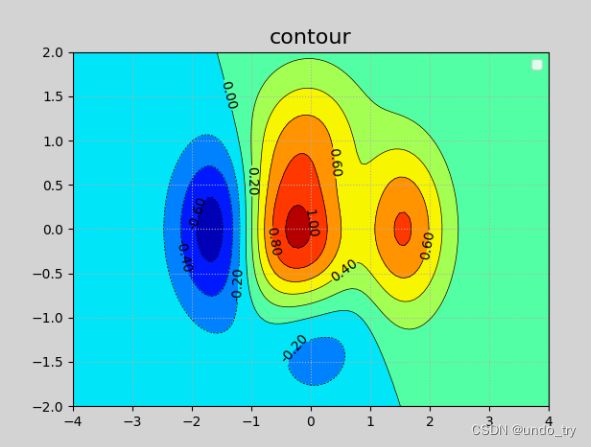
我们可以利用np.meshgrid()来画等高线图
# 等高线图
import numpy as np
import matplotlib.pyplot as plt

# 模拟海拔高度
def fz(x, y):
  z = (1 -x / 2 + x**5 + y**3) * np.exp(-x**2-y**2)
  return z

w = np.linspace(-4, 4, 100)
h = np.linspace(-2, 2, 100)

grid_x, grid_y = np.meshgrid(w, h)
z = fz(grid_x, grid_y)

plt.figure('Contour Chart',facecolor='lightgray')
plt.title('contour',fontsize=16)
plt.grid(linestyle=':')

cntr = plt.contour(
    grid_x, # 网格坐标矩阵的x坐标(2维数组)
    grid_y, # 网格坐标矩阵的y坐标(2维数组)
    z,      # 网格坐标矩阵的z坐标(2维数组)
    8,      # 等高线绘制8部分
    colors = 'black', # 等高线图颜色
    linewidths = 0.5 # 等高线图线宽
)
# 设置标签
plt.clabel(cntr, inline_spacing = 1, fmt='%.2f', fontsize=10)
# 填充颜色  大的是红色  小的是蓝色
plt.contourf(grid_x, grid_y, z, 8, cmap='jet')

plt.legend()
plt.show()
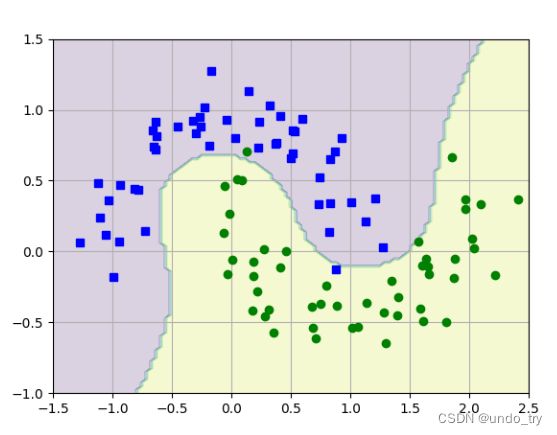
我们可以利用np.meshgrid()来画决策边界。
from sklearn.datasets import make_moons
import matplotlib.pyplot as plt
import numpy as np

from sklearn.pipeline import Pipeline
from sklearn.preprocessing import StandardScaler
from sklearn.svm import SVC


# 使用sklearn自带的moon数据
X, y = make_moons(n_samples=100,noise=0.15,random_state=42)

# 绘制生成的数据
def plot_dataset(X,y,axis):
    plt.plot(X[:,0][y == 0],X[:,1][y == 0],'bs')
    plt.plot(X[:,0][y == 1],X[:,1][y == 1],'go')
    plt.axis(axis)
    plt.grid(True,which='both')


# 画出决策边界
def plot_pred(clf,axes):
    w = np.linspace(axes[0],axes[1], 100)
    h = np.linspace(axes[2],axes[3], 100)
    grid_x, grid_y = np.meshgrid(w, h)
    # grid_x 和 grid_y 被拉成一列,然后拼接成10000行2列的矩阵,表示所有点
    grid_xy = np.c_[grid_x.ravel(), grid_y.ravel()]
    # 二维点集才可以用来预测
    y_pred = clf.predict(grid_xy).reshape(grid_x.shape)
    # 等高线
    plt.contourf(grid_x, grid_y,y_pred,alpha=0.2)


ploy_kernel_svm_clf = Pipeline(
    steps=[
        ("scaler",StandardScaler()),
        ("svm_clf",SVC(kernel='poly', degree=3, coef0=1, C=5))
    ]
)


ploy_kernel_svm_clf.fit(X,y)

plot_pred(ploy_kernel_svm_clf,[-1.5, 2.5, -1, 1.5])
plot_dataset(X, y, [-1.5, 2.5, -1, 1.5])
plt.show()
2.2 利用torch.meshgrid()生成网格所有坐标的矩阵
在目标检测YOLO中将图像划分为单元网格的部分就用到了torch.meshgrid()函数。
import torch
import numpy as np


def create_grid(input_size, stride=32):
    # 1、获取原始图像的w和h
    w, h = input_size, input_size
    # 2、获取经过32倍下采样后的feature map
    ws, hs = w // stride, h // stride
    # 3、生成网格的y坐标和x坐标
    grid_y , grid_x = torch.meshgrid([
        torch.arange(hs),
        torch.arange(ws)
    ])
    # 4、将grid_x和grid_y进行拼接,拼接后的维度为【H, W, 2】
    grid_xy = torch.stack([grid_x, grid_y], dim=-1).float()
    # 【H, W, 2】 -> 【HW, 2】
    grid_xy = grid_xy.view(-1, 2)
    return grid_xy


if __name__ == '__main__':
    print(create_grid(input_size=32*4))
# 生成网格所有坐标的矩阵
tensor([[0., 0.],
        [1., 0.],
        [2., 0.],
        [3., 0.],

        [0., 1.],
        [1., 1.],
        [2., 1.],
        [3., 1.],

        [0., 2.],
        [1., 2.],
        [2., 2.],
        [3., 2.],

        [0., 3.],
        [1., 3.],
        [2., 3.],
        [3., 3.]])


