upset 绘制
好久没有更新,今天来一个upset图的绘制
1.1 安装包
#绘制upset的包现在看来有三个
## UpSet
### 最基本的upsetR包,使用方便,但是扩展不方便
devtools::install_github("hms-dbmi/UpSetR")
## complex-upset
### UpSet的升级款 支持ggplot2
devtools::install_github('krassowski/complex-upset')
## ggupset
### 同样是UpSet的升级款 支持ggplot2
devtools::install_github("const-ae/ggupset")
示例数据
library(ggplot2)
library(ggupset)
library(ComplexUpset)
test.list <- list(
  set1 = c("a", "b", "c"),
  set2 = c("b", "c", "d", "e"),
  set3 = c("c", "d", "e", "f")
)
UpSetR
#对于list,利用fromlist()整理数据
UpSetR::upset(fromList(test.list),
              order.by = "degree", #还可以选择"degree"
              )

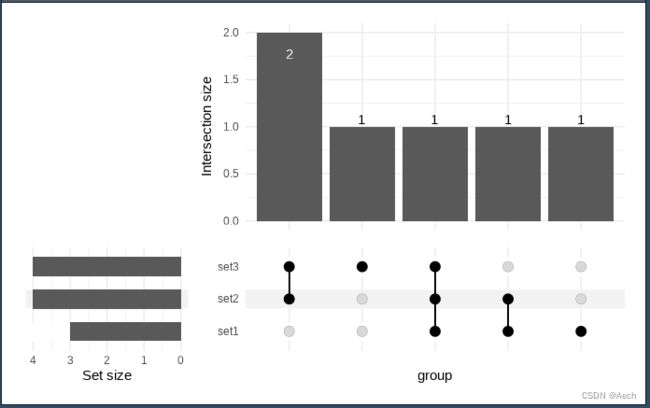
ComplexUpset
# 要求输入的是矩阵,如果数据是list,用formlist()转化一下就可以
test.df <- fromList(test.list)
ComplexUpset::upset(test.df,intersect = colnames(test.df))
# 与UpSetR不同的是支持ggplot2语法, 例如
ComplexUpset::upset(test.df, intersect = colnames(test.df), wrap= TRUE) +
  ggtitle("This is a title")

ggupset
# 同样是支持ggplot2语法, 但是输入会更加复杂一些
# 主要是通过scale_x_upset()来控制upset的输出, 例如
test.df <- fromList(test.list) %>%
  apply(2, as.logical) %>% t() %>%
  as.tibble(rownames = "setsnames") %>%
  pivot_longer(cols = -setsnames, names_to = "Sets", values_to = "stat") %>%
  filter(stat) %>%
  select(-stat) %>%
  group_by(Sets) %>%
  summarize(Set = list(setsnames))
> test.df
# A tibble: 6 × 2
  Sets  Set
  <chr> <list>
1 V1    <chr [1]>
2 V2    <chr [2]>
3 V3    <chr [3]>
4 V4    <chr [2]>
5 V5    <chr [2]>
6 V6    <chr [1]>
> str(test.df)
tibble [6 × 2] (S3: tbl_df/tbl/data.frame)
 $ Sets: chr [1:6] "V1" "V2" "V3" "V4" ...
 $ Set :List of 6
  ..$ : chr "set1"
  ..$ : chr [1:2] "set1" "set2"
  ..$ : chr [1:3] "set1" "set2" "set3"
  ..$ : chr [1:2] "set2" "set3"
  ..$ : chr [1:2] "set2" "set3"
  ..$ : chr "set3"

test.df %>%
  ggplot(aes(x = Set)) +
  geom_bar() +
  scale_x_upset(
    order_by = "degree",
    reverse = T,
  )

# 然后利用 ggplot2 增加亿点细节
test.df %>%
  ggplot(aes(x = Set)) +
  geom_bar() +
  scale_x_upset(
    order_by = "degree",
    reverse = T,
  )+
  geom_text(stat='count', aes(label=after_stat(count)), vjust=-1) +
  scale_y_continuous(name = "Intersection size",expand = c(0, 0), limits = c(0, 6))+
  theme(text = element_text(family = "ARIAL", colour = "black", size = 9))+
  xlab('')+
  theme_combmatrix(
    combmatrix.label.make_space = TRUE,
    combmatrix.label.width = NULL,
    combmatrix.label.height = NULL,
    combmatrix.label.extra_spacing = 3,
    combmatrix.label.total_extra_spacing = unit(10, "pt"),
    combmatrix.label.text = element_text(family = "ARIAL", colour = "Pink", size = 9),
    combmatrix.panel.margin = unit(c(1.5, 1.5), "pt"),
    combmatrix.panel.striped_background = TRUE,
    combmatrix.panel.striped_background.color.one = "white",
    combmatrix.panel.striped_background.color.two = "#F7F7F7",
    combmatrix.panel.point.size = 3,
    combmatrix.panel.line.size = 1.2,
    combmatrix.panel.point.color.fill = "red",
    combmatrix.panel.point.color.empty = "#E0E0E0",
  )+
  theme(panel.border = element_rect(colour = "black", fill = NA, size = 2))+
  theme(panel.background = element_blank(),
        axis.text.y = element_text(size = 9))
