python二进制文件转nc(以PIOMAS海冰厚度数据为例)
一、数据下载
数据网址Polar Science Center » PIOMAS Variables on Model Grid (uw.edu)
以其中的海冰厚度数据为例进行转化
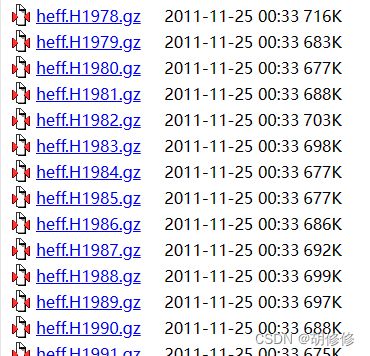
点击下载需要的年份:
首先要明白,二进制文件是4个字节按顺序依次存储所有数据,因此heff.H1979是没有记录对应的地理信息的。数据的地理信息会在另一个文件中,也就是下图中的grid.dat。这是第二个要下载的文件。
(二进制文件存储的数据和.dat文件存储的地理信息是一一对应的,及二进制第一个数据所在的位置就是.dat中第一个经纬度)
二、python进行转化
路径如图所示:girds放下载的grid.bat;sit放下载的二进制海冰厚度数据;output是输出结果文件的地方。
processor.py代码如下:
import numpy as np
import pandas as pd
import struct
import xarray as xr
import matplotlib.pyplot as plt
from cartoplot import cartoplot

grids = {}

dims = (120,360)

for i in ['lon','lat']:

    grid = np.array(pd.read_csv(f'grids/{i}grid.dat',
                                header=None,
                                delim_whitespace=True))

    flat_grid = grid.ravel()

#     if i == 'lon':

    shaped_grid = flat_grid.reshape(dims)

#     else:

#         shaped_grid = flat_grid.reshape((360,120))

    grids[i] = shaped_grid


def process_piomas(year):

    binary_dir = f'sit/heff.H{year}'

    ############################################################

    # Read File

    with open(binary_dir, mode='rb') as file:

        fileContent = file.read()
        data = struct.unpack("f" * (len(fileContent)// 4), fileContent)

    ############################################################

    # Put it in a 3D array

        native_data = np.full((12,dims[0],dims[1]),np.nan)

        for month in range(1,13):

            start = (month-1)*(dims[0]*dims[1])
            end = month*(dims[0]*dims[1])
            thickness_list = np.array(data[start:end])

            gridded = thickness_list.reshape(dims[0],dims[1])
            native_data[month-1,:,:] = gridded

#             cartoplot(grids['lon'],grids['lat'],gridded)

            plt.imshow(gridded)

            pass


    ############################################################

    # Output to NetCDF4

        ds = xr.Dataset( data_vars={'thickness':(['t','x','y'],native_data)},

                         coords =  {'longitude':(['x','y'],grids['lon']),
                                    'latitude':(['x','y'],grids['lat']),
                                    'month':(['t'],np.array(range(1,13)))})

        ds.attrs['data_name'] = 'Monthly mean Piomas sea ice thickness data'

        ds.attrs['description'] = """Sea ice thickness in meters on the native 360x120 grid,
                                    data produced by University of Washington Polar Science Center"""

        ds.attrs['year'] = f"""These data are for the year {year}"""

        ds.attrs['citation'] = """When using this data please use the citation:
                                Zhang, Jinlun and D.A. Rothrock: Modeling global sea
                                ice with a thickness and enthalpy distribution model
                                in generalized curvilinear coordinates,
                                Mon. Wea. Rev. 131(5), 681-697, 2003."""

        ds.attrs['code to read'] = """  # Example code to read a month of this data

                                        def read_month_of_piomas(year,month):

                                            data_dir = 'output/'

                                            with xr.open_dataset(f'{data_dir}{year}.nc') as data:

                                                ds_month = data.where(int(month) == data.month, drop =True)

                                                return(ds_month)"""

        ds.attrs['python author'] = """Robbie Mallett wrote this python code. If there's a problem with it,
                                        email him at [email protected]"""


        output_dir = f'output/'

        ds.to_netcdf(f'{output_dir}{year}.nc','w')

    return native_data

for year in range(1993,1994):

    x = process_piomas(year)


