一、常用的命令一、常用的命令
1.print、po输出打印
打印变量的值可以使用print(简写p)命令,该命令如果打印的是基础数据类型,则会列出基础数据类型的类型和值。如果是对象,还会打印出对象指针地址,如下所示:
(lldb) p str
(__NSCFConstantString *)$1 = 0x000000010c14e068 @"我是一个普通的字符串"
(lldb) p intDemo
(NSInteger) $2 = 2
(lldb)
print命令输出的信息中带有 $0 、 $1的字样。我们可以将它看作是lldb内部的变量,我们可以在后面的查询中直接使用这些值。比如现在我要重新取回 $1 的值(或者调用$1的方法都是可以的,注意在使用lldb内部的变量$来记录变量的时候,没有语法提示,所以你需要自己能准确的打印出方法的名字,或者在Xcode编辑器中去打好方法,然后再拷贝到lldb处)
(lldb) p $1
(__NSCFConstantString *) $1 = 0x000000010c14e068 @"我是一个普通的字符串"
每打印一个与对象相关的命令,$后面的值都会加1
print的打印信息较多,如果只想查看对象的值,则可以使用po(printobject)命令,如下所示:
(lldb)po str
我是一个普通的字符串
(lldb)po intDemo
2
对于基础数据类型,还可以指定格式打印,如用16进制的格式打印:
(lldb) p/x intDemo
(NSInteger) $14 = 0x0000000000000002
其他格式(如:八进制,二进制等)不做过多说明,感兴趣可以自己研究。
上面的例子是比较简单的,在实际开发中的应用是非常广泛的,如,打印self.view所有的子view,查看某个子view的描述等等。
2.call
call调用方法的意思,和p,po也有此功能,call可以使用在没有返回值,不需要显示输出的情况下,如设置view颜色
(lldb)call [self.view setBackgroundColor:[UIColor redColor]]
这样就不用为了看改一下颜色的效果再进行build一次了,尤其是build一次还要经过漫长的等待。
3.expression表达式(expr)
expr常用于调试时修改变量的值,如进入商品详情页之后,我想使用一个测试商品进行测试,这时,不需要修改代码再重新编译就可以看到效果,来试验一下。我在viewDidLoad中打一个断点,进入商品详情页,到断点位置后,输入expr命令来修改productId·和skuId,然后继续运行,OK了,省去了写测试代码和编译的时间,事半功倍有没有!
(lldb)expr self.productId=@"A0000001076"(__NSCFString*)$0=0x00007ffc78a8f300@"A0000001076"
(lldb)expr self.currentSkuId=@"sku10210013"(__NSCFString*)$1=0x00007ffc790610c0@"sku10210013"
它的作用不仅仅是修改变量的值,你加其他功能的代码也是可以的,只要是和上下文相关的一句代码就OK,如:初始化导航栏之后,我想修改一下它的颜色,看一下效果,如下:
(lldb)expr self.superNavBarView.backgroundColor=[UIColor redColor](UICachedDeviceRGBColor*)$3=0x00007ffc783d0290
注意:表达式之后不需要加分号,加了分号之后会报错
4.image
(1)image lookup --address寻址,定位异常代码位置
举例说明,下面这段代码,执行的时候必然会出现异常,因为越界了
NSString*str=@"245656";
[str substringFromIndex:10];
控制台输出了以下崩溃信息:
2016-05-2714:58:54.173GomeEShop[61425:4544758]***Terminating app due to uncaught exception'NSRangeException',reason:'*** -[__NSCFConstantString substringFromIndex:]: Index 10 out of bounds; string length 6'***Firstthrowcall stack:(0CoreFoundation0x000000010e99ad85__exceptionPreprocess+1651libobjc.A.dylib0x000000011360ddebobjc_exception_throw+482CoreFoundation0x000000010e99acbd+[NSException raise:format:]+2053Foundation0x000000010f8698bd-[NSString substringFromIndex:]+1264GomeEShop0x00000001097c396f-[GMFPTGoodsDetailVC initNecessaryViews]+39035GomeEShop0x00000001097c1c51-[GMFPTGoodsDetailVC viewDidLoad]+3696UIKit0x00000001110ae984-[UIViewController loadViewIfRequired]+11987UIKit0x00000001110b493b-[UIViewController __viewWillAppear:]+1208UIKit0x00000001110e4750-[UINavigationController _startCustomTransition:]+12039UIKit0x00000001110f4b9b-[UINavigationController _startDeferredTransitionIfNeeded:]+71210UIKit0x00000001110f5d0b-[UINavigationController __viewWillLayoutSubviews]+5711UIKit0x00000001112a4503-[UILayoutContainerView layoutSubviews]+24812UIKit0x0000000110fce980-[UIView(CALayerDelegate)layoutSublayersOfLayer:]+70313QuartzCore0x0000000110c85c00-[CALayer layoutSublayers]+14614QuartzCore0x0000000110c7a08e_ZN2CA5Layer16layout_if_neededEPNS_11TransactionE+36615QuartzCore0x0000000110c79f0c_ZN2CA5Layer28layout_and_display_if_neededEPNS_11TransactionE+2416QuartzCore0x0000000110c6e3c9_ZN2CA7Context18commit_transactionEPNS_11TransactionE+27717QuartzCore0x0000000110c9c086_ZN2CA11Transaction6commitEv+48618UIKit0x0000000110f4019b_afterCACommitHandler+17419CoreFoundation0x000000010e8bfc37__CFRUNLOOP_IS_CALLING_OUT_TO_AN_OBSERVER_CALLBACK_FUNCTION__+2320CoreFoundation0x000000010e8bfba7__CFRunLoopDoObservers+39121CoreFoundation0x000000010e8b57fb__CFRunLoopRun+114722CoreFoundation0x000000010e8b50f8CFRunLoopRunSpecific+48823GraphicsServices0x000000011481bad2GSEventRunModal+16124UIKit0x0000000110f13f09UIApplicationMain+17125GomeEShop0x00000001091c0ebfmain+11126libdyld.dylib0x0000000113ba992dstart+1)libc++abi.dylib:terminating with uncaught exception of type NSException
通过异常信息,我们看到崩溃很可能发生在-[GMFPTGoodsDetailVC initNecessaryViews]方法中,也就是地址0x00000001097c396f,我们输入以下命令来进行精确定位
(lldb) image lookup --address 0x00000001097c396f
执行后输出以下信息
Address:GomeEShop[0x00000001006af96f](GomeEShop.__TEXT.__text + 7000239)
Summary:GomeEShop`-[GMFPTGoodsDetailVC initNecessaryViews] + 3903 at GMFPTGoodsDetailVC.m:589
我们看到出错的位置在GMFPTGoodsDetailVC.m文件中的initNecessaryViews方法中,第589行
(2)image lookup --type查看类型
我们还可以使用image lookup命令来查看具体的类型,如下所示:
(lldb)image lookup --type UIImage
执行后输出了UIImage所包含的属性
Best match found in /Users/zhangbeibei/Library/Developer/Xcode/DerivedData/GomeEShop-dhpyydtykrwzvpawiualtxfthsqy/Build/Products/Debug-iphonesimulator/GomeEShop.app/GomeEShop:id = {0x00cabeb2}, name = "UIImage", byte-size = 8, decl = UIImage.h:53, compiler_type = "@interface UIImage : NSObject@property ( readonly,getter = size,setter =
,nonatomic ) CGSize size;@property ( readonly,getter = CGImage,setter = ,nonatomic ) CGImageRef CGImage;@property ( readonly,getter = CIImage,setter = ,nonatomic ) CIImage * CIImage;@property ( readonly,getter = imageOrientation,setter = ,nonatomic ) UIImageOrientation imageOrientation;@property ( readonly,getter = scale,setter = ,nonatomic ) CGFloat scale;@property ( readonly,getter = images,setter = ,nonatomic ) NSArray * images;@property ( readonly,getter = duration,setter = ,nonatomic ) NSTimeInterval duration;@property ( readonly,getter = capInsets,setter = ,nonatomic ) UIEdgeInsets capInsets;@property ( readonly,getter = resizingMode,setter = ,nonatomic ) UIImageResizingMode resizingMode;@property ( readonly,getter = alignmentRectInsets,setter = ,nonatomic ) UIEdgeInsets alignmentRectInsets;@property ( readonly,getter = renderingMode,setter = ,nonatomic ) UIImageRenderingMode renderingMode;@property ( readonly,getter = traitCollection,setter = ,copy,nonatomic ) UITraitCollection * traitCollection;@property ( readonly,getter = imageAsset,setter = ,nonatomic ) UIImageAsset * imageAsset;@property ( readonly,getter = flipsForRightToLeftLayoutDirection,setter = ,nonatomic ) BOOL flipsForRightToLeftLayoutDirection;@end"
5.bt
我们可以用bt来打印调用堆栈,加all可打印多有thread的堆栈,如下图
(lldb) bt
* thread #1: tid = 0x4558f6, 0x0000000113eedf06 libsystem_kernel.dylib`__pthread_kill + 10, queue = 'com.apple.main-thread', stop reason = signal SIGABRT
frame #0: 0x0000000113eedf06 libsystem_kernel.dylib`__pthread_kill + 10
frame #1: 0x0000000113eb54ec libsystem_pthread.dylib`pthread_kill + 90
frame #2: 0x0000000113c4fcec libsystem_c.dylib`abort + 129
frame #3: 0x0000000113a4e051 libc++abi.dylib`abort_message + 257
frame #4: 0x0000000113a73ac9 libc++abi.dylib`default_terminate_handler() + 267
frame #5: 0x000000011360e046 libobjc.A.dylib`_objc_terminate() + 103
frame #6: 0x0000000113a7126e libc++abi.dylib`std::__terminate(void (*)()) + 8
frame #7: 0x0000000113a70ef9 libc++abi.dylib`__cxa_rethrow + 99
frame #8: 0x000000011360df5e libobjc.A.dylib`objc_exception_rethrow + 40
frame #9: 0x000000010e8b51b4 CoreFoundation`CFRunLoopRunSpecific + 676
frame #10: 0x000000011481bad2 GraphicsServices`GSEventRunModal + 161
frame #11: 0x0000000110f13f09 UIKit`UIApplicationMain + 171
* frame #12: 0x00000001091c0ebf GomeEShop`main(argc=1, argv=0x00007fff56aea5f8) + 111 at main.m:16
frame #13: 0x0000000113ba992d libdyld.dylib`start + 1
frame #14: 0x0000000113ba992d libdyld.dylib`start + 1
二、断点编辑
1.设置触发条件
我们在进行断点调试时,可以为断点设置触发条件,以便针对特定的数据进行分析,观察程序运行正常,如在首页的403行设置一个断点,触发条件是isCache为NO
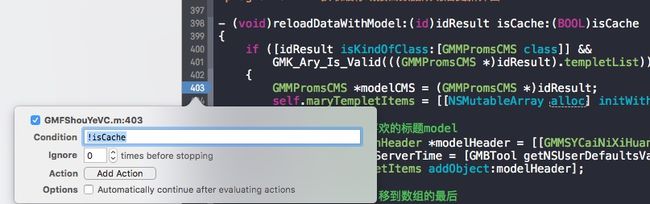
这样当刷新数据且数据是从缓存中读取的时候,该断点生效
2.设置触发事件
在编辑断点时从Action选项列表中可以看到,断点的触发事件有AppleScript、Capture GPU Frame、Debugger Command、Log Message、Shell Command、Sound这几种。
Debugger Command
它和上述说的在控制台输入的命令是一样的,可以起到相同的效果,但是它的方便之处在于,如果你勾选了Automatically continue after evaluating actions,在断点处程序不会中断,会正常运行。不足之处是,输入命令时没有联想提示,不太方便。
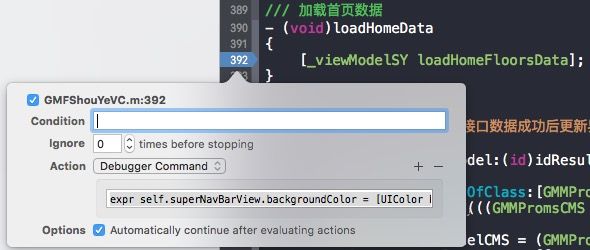
如下图,在加载首页数据时的断点处,添加了命令expr self.superNavBarView.backgroundColor = [UIColor blueColor],再勾选上Automatically continue after evaluating actions,执行到此处的时候不会停止,而且导航栏的颜色变成了蓝色。
使用Debugger Command,再加po命令可以随心所欲的输出你需要的信息,而你就不用为了调试一个东西而加一句NSLog然后再重新编译一次看结果了,代码中也少了很多NSLog这样的语句,是不是简洁多了。
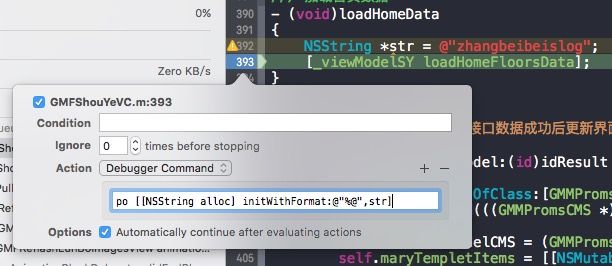
注意:经试验在这里输出格式化字符串时,不能使用[NSString stringWithFormat:@"%@",str],否则会报下面的错误,要使用上图中的[[NSString alloc] initWithFormat:@"%@",str]才可以,是不是有点怪
error:too many arguments to method call,expected1,have2
error:1errors parsing expression
Log Message
看字面意思就知道这个是输出log,在输入框中直接输入你想输出的内容接,比Debugger Command+po方便,但是它很直白,不能输出变量等信息,只能输出静态字符串,如下图,输出的内容就是输入的内容,不会被格式化
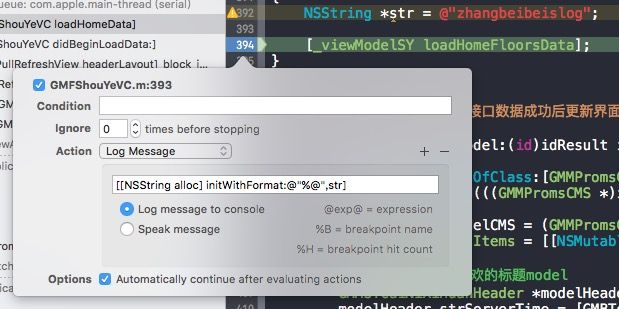
输出内容就是[[NSString alloc] initWithFormat:@"%@",str]
Sound
设置声音,当代码执行到断点处时,会有提示音,对我们来说不是经常用
其他几种就不做探究了,因为我也不是很懂,呵呵。。。
三、命令的简称和别名
1.简称
很多时候,LLDB完整的命令是很长的。比如前面所说的image lookup --address这个组合命令。为了方便日常的使用,提高效率,LLDB命令也提供通过简称的方式调用命令。如image lookup —address这个 命令,可以简写为im loo -a,expression简写为expr,print简写为p等等,自己去发现吧。
2.别名
除了使用命令的简称外,对于不好记忆的命令,我们还可以为它设置别名,现在我们为imagelookup –address设置一个别名叫imgadd
输入命令:
command alias imgadd image lookup --address %1
然后再使用imgadd命令和imagelookup –address就是一样的了,不过我发现比较坑的是,重新编译一次工程后,设置的别名就不好使了,还是使用原名吧,在Xcode控制台输入命令时都会有联想提示,也比较方便
以上介绍的命令是比较常用的一些,然而lldb的命令远不只有这些,想知道还有哪些,输入help,查看一下
(lldb)help
Debuggercommands:
apropos--Finda list of debugger commands related to a particular word/subject.breakpoint--Asetof commandsforoperating on breakpoints.Alsosee _regexp-break.bugreport--Setof commandsforcreating domain specific bugreports.command--Asetof commandsformanaging or customizing the debugger commands.disassemble--Disassemblebytesinthe current function,or elsewhereinthe executable programasspecified by the user.expression--Evaluatean expression(ObjC++or Swift)inthe current program context,usinguser defined variables and variables currentlyinscope.frame--Asetof commandsforoperating on the current thread's frames.gdb-remote--Connectto a remoteGDBserver.Ifno hostnameisprovided,localhostisassumed.gui--Switchintothe curses basedGUImode.help--Showa list of all debugger commands,or give details about specific commands.kdp-remote--Connectto a remoteKDPserver.udp port41139isthedefaultport number.language--Asetof commandsformanaging language-specific functionality.'.log--Asetof commandsforoperating on logs.memory--Asetof commandsforoperating on memory.platform--Asetof commands to manage and create platforms.plugin--Asetof commandsformanaging or customizing plugin commands.process--Asetof commandsforoperating on a process.quit--Quitoutof theLLDBdebugger.register--Asetof commands to access thread registers.script--Passan expression to the script interpreterforevaluation andreturnthe results.Dropintothe interactive interpreterifno expressionisgiven.settings--Asetof commandsformanipulatinginternalsettable debugger variables.source--Asetof commandsforaccessing source file information target--Asetof commandsforoperating on debugger targets.thread--Asetof commandsforoperating on one or more threads within a running process.type--Asetof commandsforoperating on the type system version--Showversion ofLLDBdebugger.watchpoint--Asetof commandsforoperating on watchpoints.Currentcommand abbreviations(type'help command alias'formore info):add-dsym--('target symbols add')Adda debug symbol file to one of the target's current modules by specifying a path to a debug symbols file,orusingthe options to specify a module to download symbolsfor.attach--('_regexp-attach')Attachto a process idifindecimal,otherwise treat the argumentasa process name to attach to.b--('_regexp-break')Seta breakpointusinga regular expression to specify the location,where
isindecimalandisinhex.bt--('_regexp-bt')Showa backtrace.Anoptional argumentisaccepted;ifthat argumentisa number,it specifies the number of frames to display.Ifthat argumentis'all',full backtraces of all threads are displayed.c--('process continue')Continueexecution of all threadsinthe current process.call--('expression --')Evaluatean expression(ObjC++or Swift)inthe current program context,usinguser defined variables and variables currentlyinscope.continue--('process continue')Continueexecution of all threadsinthe current process.detach--('process detach')Detachfromthe current process being debugged.di--('disassemble')Disassemblebytesinthe current function,or elsewhereinthe executable programasspecified by the user.dis--('disassemble')Disassemblebytesinthe current function,or elsewhereinthe executable programasspecified by the user.display--('_regexp-display')Addan expression evaluation stop-hook.down--('_regexp-down')Godown"n"framesinthe stack(1frame bydefault).env--('_regexp-env')Implementsa shortcut to viewing and setting environment variables.exit--('quit')Quitoutof theLLDBdebugger.f--('frame select')Selecta frame by indexfromwithin the current thread and make it the current frame.file--('target create')Createa targetusingthe argumentasthe main executable.finish--('thread step-out')Finishexecuting the function of the currently selected frame andreturnto its call siteinspecified thread(current thread,ifnone specified).image--('target modules')Asetof commandsforaccessing informationforone or more target modules.j--('_regexp-jump')Setsthe program counter to anewaddress.jump--('_regexp-jump')Setsthe program counter to anewaddress.kill--('process kill')Terminatethe current process being debugged.l--('_regexp-list')Implementsthe GDB'list'commandinall of its forms except FILE:FUNCTIONand maps them to the appropriate'source list'commands.list--('_regexp-list')Implementsthe GDB'list'commandinall of its forms except FILE:FUNCTIONand maps them to the appropriate'source list'commands.n--('thread step-over')Sourcelevel single stepinspecified thread(current thread,ifnone specified),stepping over calls.next--('thread step-over')Sourcelevel single stepinspecified thread(current thread,ifnone specified),stepping over calls.nexti--('thread step-inst-over')Singlestep one instructioninspecified thread(current thread,ifnone specified),stepping over calls.ni--('thread step-inst-over')Singlestep one instructioninspecified thread(current thread,ifnone specified),stepping over calls.p--('expression --')Evaluatean expression(ObjC++or Swift)inthe current program context,usinguser defined variables and variables currentlyinscope.po--('expression -O -- ')Evaluatean expression(ObjC++or Swift)inthe current program context,usinguser defined variables and variables currentlyinscope.print--('expression --')Evaluatean expression(ObjC++or Swift)inthe current program context,usinguser defined variables and variables currentlyinscope.q--('quit')Quitoutof theLLDBdebugger.r--('process launch -X true --')Launchthe executableinthe debugger.rbreak--('breakpoint set -r %1')Setsa breakpoint orsetof breakpointsinthe executable.repl--('expression -r -- ')Evaluatean expression(ObjC++or Swift)inthe current program context,usinguser defined variables and variables currentlyinscope.run--('process launch -X true --')Launchthe executableinthe debugger.s--('thread step-in')Sourcelevel single stepinspecified thread(current thread,ifnone specified).si--('thread step-inst')Singlestep one instructioninspecified thread(current thread,ifnone specified).step--('thread step-in')Sourcelevel single stepinspecified thread(current thread,ifnone specified).stepi--('thread step-inst')Singlestep one instructioninspecified thread(current thread,ifnone specified).t--('thread select')Selecta threadasthe currently active thread.tbreak--('_regexp-tbreak')Seta one shot breakpointusinga regular expression to specify the location,where isindecimalandisinhex.undisplay--('_regexp-undisplay')Removean expression evaluation stop-hook.up--('_regexp-up')Goup"n"framesinthe stack(1frame bydefault).x--('memory read')Readfromthe memory of the process being debugged.Formore information on any command,type'help '.
正如上述最后一句所说,想了解某个命令的更多信息,输入help +命令名即可
引用链接:https://www.jianshu.com/p/9a71329d5c4d