2021-10-21 统计学-基于R(第四版)第五章课后习题记录及总结
5.1 题目如下
代码如下:
> install.packages("BSDA")
> library(BSDA)
> example5_1<-read.csv("D:/作业/统计学R/《统计学—基于R》(第4版)—例题和习题数据(公开资源)/exercise/chap05/exercise5_1.csv")
> z.test(example5_1$上网时间,mu=0,sigma.x = sd(example5_1$上网时间),conf.level = 0.90)$conf.int
[1] 2.875476 3.757857
attr(,"conf.level")
[1] 0.9
> z.test(example5_1$上网时间,mu=0,sigma.x = sd(example5_1$上网时间),conf.level = 0.95)$conf.int
[1] 2.790956 3.842377
attr(,"conf.level")
[1] 0.95
> z.test(example5_1$上网时间,mu=0,sigma.x = sd(example5_1$上网时间),conf.level = 0.99)$conf.int
[1] 2.625766 4.007567
attr(,"conf.level")
[1] 0.99
选用z分布是因为样本属于大样本(n>=30),小样本则选择t分布
z.test的参数y=NULL用于单样本,mu表示样本均值,sigma.x和sigma.y用于指定两个总体的标准差,当总体标准差未知时用样本标准差代替,conf.level用于指定置信水平,默认0.95
加$conf.int代表只输出置信区间的信息
5.2 题目如下
代码如下:
> n<-50
> x<-32
> p<-x/n
> q<-qnorm(0.975)  //q即Z0.025
> LCI<-p-q*sqrt(p*(1-p)/n)
> UCI<-p+q*sqrt(p*(1-p)/n)
> data.frame(LCI,UCI)
        LCI       UCI
1 0.5069532 0.7730468
相关知识见课本,套用公式即可
5.3 题目如下
(1)代码如下:
> example5_3<-read.csv("D:/作业/统计学R/《统计学—基于R》(第4版)—例题和习题数据(公开资源)/exercise/chap05/exercise5_3.csv")
> t.test(example5_3$方式1,conf.level = 0.95)$conf.int  //小样本,均值
[1] 6.809005 7.490995
attr(,"conf.level")
[1] 0.95
(2)代码如下:
> install.packages("TeachingDemos")
> library(TeachingDemos)
> sigma.test(example5_3$方式2,conf.level = 0.95)$conf.int  //方差
[1]  1.569961 11.059516
attr(,"conf.level")
[1] 0.95
(3)代码如下:
//方差不相等
> t.test(x=example5_3$方式1,y=example5_3$方式2,var.equal=TRUE,conf.level = 0.95)$conf.int
[1] -1.250985  1.250985
attr(,"conf.level")
[1] 0.95
//方差相等
> t.test(x=example5_3$方式1,y=example5_3$方式2,var.equal=FALSE,conf.level = 0.95)$conf.int
[1] -1.322758  1.322758
attr(,"conf.level")
[1] 0.95
5.4 题目如下
代码如下:
> example5_4<-read.csv("D:/作业/统计学R/《统计学—基于R》(第4版)—例题和习题数据(公开资源)/exercise/chap05/exercise5_4.csv")
> t.test(example5_4$方法1,example5_4$方法2,paired=TRUE,conf.level = 0.95)$conf.int //小样本
[1]  6.327308 15.672692
attr(,"conf.level")
[1] 0.95
paired=TRUE表示样本为配对样本(非独立样本),即一个样本中的数据与另一个样本中的数据相对应,体现样本真正差异
5.5 题目如下
(1)代码如下:
> p1<-0.40
> p2<-0.30
> q<-qnorm(0.95)
> LCI<-p1-p2-q*sqrt(p1*(1-p1)/250+p2*(1-p2)/250)
> UCI<-p1-p2+q*sqrt(p1*(1-p1)/250+p2*(1-p2)/250)
> data.frame(LCI,UCI)
         LCI       UCI
1 0.03021477 0.1697852
(2)代码如下:
> p1<-0.40
> p2<-0.30
> q<-qnorm(0.975)
> LCI<-p1-p2-q*sqrt(p1*(1-p1)/250+p2*(1-p2)/250)
> UCI<-p1-p2+q*sqrt(p1*(1-p1)/250+p2*(1-p2)/250)
> data.frame(LCI,UCI)
         LCI       UCI
1 0.01684577 0.1831542
相关知识见课本,套用公式即可
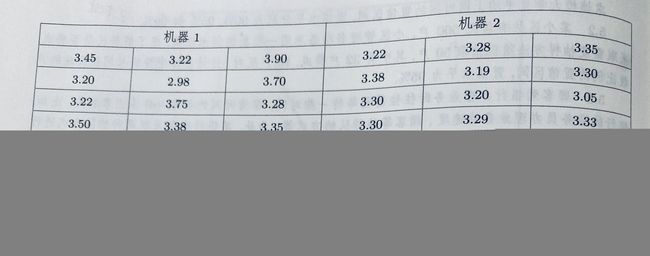
5.6 题目如下
代码如下:
> example5_6<-read.csv("D:/作业/统计学R/《统计学—基于R》(第4版)—例题和习题数据(公开资源)/exercise/chap05/exercise5_6.csv")
> var.test(example5_6$机器1,example5_6$机器2,alternative="two.sided",conf.level = 0.95)$conf.int
[1]  4.051926 24.610112
attr(,"conf.level")
[1] 0.95
本次记录就到这里,其实也没什么技术含量,就是套用课本的公式而已,就简单地作为一个记录吧。


