echarts如何将柱形图的柱子分割成一小块一小块,也就是象形柱图
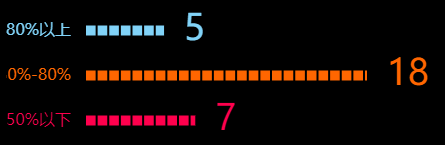
关键点:series.type: “pictorialBar”,
<div class="cl-top-content" id="deviceOee" style="width:500px;height:200px"></div>


mounted() {
    this.barChart();
  },
//设备OEE
    barChart() {
      let myChart = this.$echarts.init(document.getElementById("deviceOee"));
      let option = {
        xAxis: {
          splitLine: {
            show: false,
          },
          axisLine: {
            show: false,
          },
          axisLabel: {
            show: false,
          },
          axisTick: {
            show: false,
          },
        },
        grid: {
          left: 80,
          top: 20, // 设置条形图的边距
          right: 80,
          bottom: 20,
        },
        yAxis: [
          {
            type: "category",
            show: true,
            inverse: false,
            data: ["80%以上", "50%-80%", "50%以下"],
            axisLine: {
              show: false,
            },
            axisTick: {
              show: false,
            },
            axisLabel: {
              // 坐标轴刻度标签的相关设置
              show: true,
              margin: 15,
              textStyle: {
                fontSize: 16,
                color: function (value) {
                  return value == "80%以上"
                    ? "#81D3F8"
                    : value == "50%-80%"
                    ? "#FF6600"
                    : "#FF004D";
                },
              },
              interval: 0,
            },
            inverse: true,
          },
        ],
        series: [
          {
            // 内
            type: "bar",
            barWidth: 10,
            legendHoverLink: false,
            silent: true,
            itemStyle: {
              normal: {
                // barBorderRadius: [4, 4, 4, 4],
                color: function (params) {
                  var colorlist = ["#81D3F8", "#FF6600", "#FF004D"];
                  return colorlist[params.dataIndex];
                },
              },
            },
            label: {
              normal: {
                show: true,
                position: "right",
                distance: 20, //距离柱形的距离
                // formatter: "{b}",
                textStyle: {
                  color: "inherit", //映射颜色
                  fontSize: 36,
                },
              },
            },
            data: [
              {
                name: "80%以上",
                value: 5,
              },
              {
                name: "50%-80%",
                value: 18,
              },
              {
                name: "50%以下",
                value: 7,
              },
            ],
            z: 1,
            animationEasing: "elasticOut",
          },
          {
            // 分隔
            type: "pictorialBar",
            itemStyle: {
              normal: {
                color: "#000",
              },
            },
            symbolRepeat: "fixed",
            symbolMargin: 5, //图形的两边间隔
            symbol: "rect",
            symbolClip: true, //是否裁剪图形
            symbolSize: [2, 20],
            symbolPosition: "start", //图形的定位位置。
            symbolOffset: [-2, 0], //图形相对于原本位置的偏移。
            data: [
              {
                name: "80%以上",
                value: 5,
              },
              {
                name: "50%-80%",
                value: 18,
              },
              {
                name: "50%以下",
                value: 7,
              },
            ],
            z: 2,
            animationEasing: "elasticOut",
          },
        ],
      };
      // 使用刚指定的配置项和数据显示图表。
      myChart.setOption(option);
      //若盒子宽度设为百分比,这里做自适应
      window.addEventListener("resize", () => {
        if (myChart) {
          myChart.resize();
        }
      });
    },
  },