无监督学习Principal Component Analysis(PCA)精简高维数据
目录
介绍
一、PCA之前
二、PCA之后
介绍
Principal Component Analysis (PCA) 是一种常用的数据降维和特征提取技术。PCA通过线性变换将高维数据映射到低维空间,从而得到数据的主要特征。PCA的目标是找到一个正交基的集合,使得将数据投影到这些基上时,能够保留尽可能多的数据信息。每个正交基称为一个主成分,它的重要性通过其对应的特征值来衡量。PCA通过计算特征值和特征向量,找到数据中最重要的特征,将数据投影到这些特征上,从而达到降维和提取主要特征的目的。通过PCA可以减少数据的维度,并且可以保留数据的主要特征,以便于后续的数据分析和建模。
import numpy as np
import matplotlib.pyplot as plt
import seaborn as sns; sns.set(style='white')
%matplotlib inline
%config InlineBackend.figure_format = 'retina'
from sklearn import decomposition
from sklearn import datasets
from mpl_toolkits.mplot3d import Axes3D

# Loading the dataset
iris = datasets.load_iris()
X = iris.data
y = iris.target
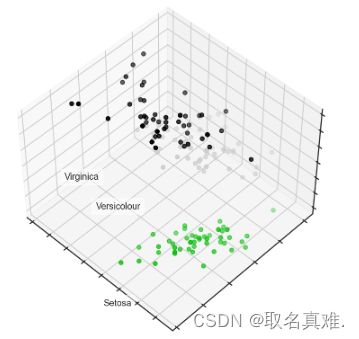
fig = plt.figure(1, figsize=(6, 5))
plt.clf()
ax = Axes3D(fig, rect=[0, 0, .95, 1], elev=48, azim=134)
plt.cla()
for name, label in [('Setosa', 0), ('Versicolour', 1), ('Virginica', 2)]:
ax.text3D(X[y == label, 0].mean(),
X[y == label, 1].mean() + 1.5,
X[y == label, 2].mean(), name,
horizontalalignment='center',
bbox=dict(alpha=.5, edgecolor='w', facecolor='w'))
# Change the order of labels, so that they match
y_clr = np.choose(y, [1, 2, 0]).astype(np.float64)
ax.scatter(X[:, 0], X[:, 1], X[:, 2], c=y_clr,
cmap=plt.cm.nipy_spectral)
ax.xaxis.set_ticklabels([])
ax.yaxis.set_ticklabels([])
ax.zaxis.set_ticklabels([]);一、PCA之前
from sklearn.tree import DecisionTreeClassifier
from sklearn.model_selection import train_test_split
from sklearn.metrics import accuracy_score, roc_auc_score

# Train, test splits
X_train, X_test, y_train, y_test = train_test_split(X, y, test_size=.3,
                                                    stratify=y,
                                                    random_state=42)

# Decision trees with depth = 2
clf = DecisionTreeClassifier(max_depth=2, random_state=42)
clf.fit(X_train, y_train)
preds = clf.predict_proba(X_test)
print('Accuracy: {:.5f}'.format(accuracy_score(y_test,
                                                preds.argmax(axis=1))))

#结果:Accuracy: 0.88889
二、PCA之后
from sklearn.preprocessing import MinMaxScaler
scaler = MinMaxScaler()
scaler.fit(X)
data_rescaled = scaler.fit_transform(X)
data_rescaled.shape
# Using PCA from sklearn PCA
pca = decomposition.PCA(n_components=2)
pca.fit(data_rescaled)
X_pca = pca.transform(data_rescaled)
# Plotting the results of PCA
plt.plot(X_pca[y == 0, 0], X_pca[y == 0, 1], 'bo', label='Setosa')
plt.plot(X_pca[y == 1, 0], X_pca[y == 1, 1], 'go', label='Versicolour')
plt.plot(X_pca[y == 2, 0], X_pca[y == 2, 1], 'ro', label='Virginica')
plt.legend(loc=0);# Test-train split and apply PCA
X_train, X_test, y_train, y_test = train_test_split(X_pca, y, test_size=.3,
stratify=y,
random_state=42)
clf = DecisionTreeClassifier(max_depth=2, random_state=42)
clf.fit(X_train, y_train)
preds = clf.predict_proba(X_test)
print('Accuracy: {:.5f}'.format(accuracy_score(y_test,
preds.argmax(axis=1))))
#结果:Accuracy: 0.91111for i, component in enumerate(pca.components_):
print("{} component: {}% of initial variance".format(i + 1,
round(100 * pca.explained_variance_ratio_[i], 2)))
print(" + ".join("%.3f x %s" % (value, name)
for value, name in zip(component,
iris.feature_names)))
'''结果:四维数据降为两维
1 component: 84.14% of initial variance
0.425 x sepal length (cm) + -0.151 x sepal width (cm) + 0.616 x petal length (cm) + 0.646 x petal width (cm)
2 component: 11.75% of initial variance
0.423 x sepal length (cm) + 0.904 x sepal width (cm) + -0.060 x petal length (cm) + -0.010 x petal width (cm)
'''
pca.explained_variance_ratio_
#结果:array([0.84136038, 0.11751808])plt.figure(figsize=(10,7))
plt.plot(np.cumsum(pca.explained_variance_ratio_), color='k', lw=2)
plt.xlabel('Number of components')
plt.ylabel('Total explained variance')
plt.xlim(0, 4)
#plt.yticks(np.arange(0.8, 1.1, 0.1))
plt.axvline(21, c='b')
plt.axhline(0.95, c='r')
plt.show();

