t10_Adapting to Market Participantsand Conditions
So far, we've gone over all the concepts and ideas involved in algorithmic trading. We went from introducing the different components and players of an algorithmic trading ecosystem to going over practical examples of trading signals, adding predictive analytics into algorithmic trading strategies, and actually building several commonly used basic, as well as sophisticated, trading strategies. We also developed ideas and a system to control risk and manage it over the evolution of a trading strategy. And finally, we went over the infrastructure components required to run these trading strategies as well as the simulator/backtesting research environment required to analyze trading strategy behavior. At this point in the book, you should be able to successfully develop a deep understanding of all the components and sophistication needed to build, improve, and safely deploy all components of an algorithmic trading strategy business stack.
The goal in this final section of the book is to begin to look beyond the deployment and operation of algorithmic trading strategies by considering things that can go wrong in live markets or slowly deteriorate[dɪˈtɪriəreɪt]恶化,变坏 as time passes, by trading signal edges vanish, and how new market participants are added, or more informed participants join the market and less informed participants leave. Financial markets and market participants are in a constant state of evolution, so algorithmic trading businesses that are able to evolve over time and in the face of changing market conditions, adapt to new conditions, and continue to be profitable, are the only ones that can survive long term. This is an extremely challenging problem to tackle, but in this chapter, we will go over the hurdles[ˈhɜːrdlz]障碍 we typically encounter and offer some guidance on how to tackle them. We will discuss why strategies do not perform as expected when deployed in live trading markets – and show examples of how to address those issues in the strategies themselves or the underlying assumptions. We will also discuss why strategies that are performing well slowly deteriorate in performance, and then we'll look at some simple examples to explain how to address these.
In this chapter, we will cover the following topics:
- Strategy performance in backtester versus live markets
- Continued profitability in algorithmic trading
Strategy performance in backtester versus live markets
In this section, let's first tackle a very common problem encountered by a lot of algorithmic trading participants that lack sophistication in their backtesters/simulators. Since backtesters are a cornerstone in building, analyzing, and comparing algorithmic trading strategies irrespective[ˌɪrɪˈspektɪv]不考虑,不顾 of position holding times, if backtested results are not realized in live trading markets, it's difficult to get off the ground起飞,开始,(使)取得进展 or continue trading. Typically, the shorter the position holding period and the larger the trading sizes, the greater the chance that simulation results are different from results actually achieved in live trading markets. Backtesters are often the most complex software component in a lot of high frequency trading (HFT) business because of the need to simulate very accurately. Also, the more complex or non-intuitive the trading model, the better the simulator needs to be, because it is often difficult to follow very fast automated trading using complex trading signals, predictions, and strategies in live markets given that they are not intuitive.
The basic problem boils down to trade prices and trade sizes for an algorithmic trading strategy not being identical in backtester and live markets. Since a trading strategy's performance is a direct function of the trade prices and the trade sizes it executes, it's not hard to see why this issue would cause differences in backtested results and live trading results, which we will refer to as simulation dislocations模拟错位 from live trading.
Sometimes, the backtester is pessimistic[ˌpesɪˈmɪstɪk]悲观的 in awarding executions to the trading strategy, or does so at worse prices than what is achieved in live trading. Such a backtester is pessimistic, and live trading results can be much better than backtested results.
Sometimes, the backtester is optimistic in awarding executions to the trading strategy, or
does so at better prices than what is achieved in live trading. Such a backtester is optimistic and live trading results can be worse than backtested results.
It is possible for the backtester to either be consistently pessimistic or consistently optimistic, or vary depending on the trading strategy type, market conditions, time of day, and so on. Backtesters that have a consistent bias are easier to deal with because, after a few live deployments, you can get an idea of, and quantify, the pessimism/optimism and use that to adjust expectations from historical results. Unfortunately, more often than not, backtesters have dislocations that cause differences in results that are not consistently biased, and which are much harder to quantify and account for.
Let's have a look at the following plot, which represents the pessimistic backtester: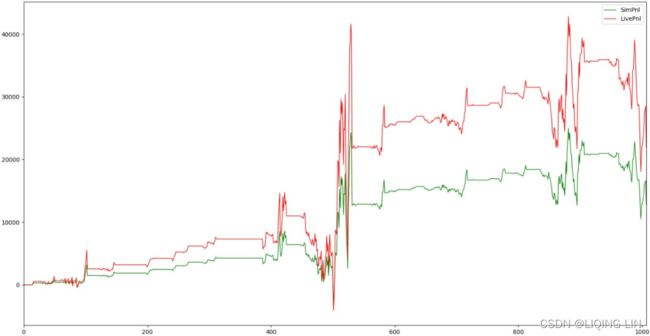
With a pessimistic backtester, live results deviate from simulated results but, overall, the trend is that live PnLs remain higher than simulated results.
Now, let's have a look at the following plot, which represents the optimistic backtester: 
With an optimistic backtester, live results deviate from simulated results but, overall, the trend is that live PnLs remain lower than simulated results.
Impact of backtester dislocations
Not having a good backtester causes a variety of problems with the historical research and live deployment of algorithmic trading strategies. Let's look at these in more detail.
Signal validation
When we research and develop trading signals, we are able to compare predictions in price movements with actual price movements realized in the market based on historical data. This, of course, doesn't necessarily require a fully-fledged[ˌfʊli ˈfledʒd]成熟的;羽毛丰满的 backtester, but does require a historical data playback software. This component, while less complex than a backtester, still has a decent amount of complexity to it and must be accurate in synchronizing different market data sources and playing market data back with accurate timestamps and event synchronization. If the market data played back in historical research platforms is not identical to what is received in live trading strategies, then the signal predictions and performance observed in historical research is not realized in live trading and can kill the profitability of a trading strategy.
Strategy validation
Strategy performance in backtester requires more complexity in the backtester than just the ability to properly synchronize and play back market data for multiple trading instruments over historically available market data, which is a requirement for signal validation that we discussed in the previous section. Here, we need to go one step further and build a backtester that can actually simulate the behavior and performance of a trading strategy over historical data as if it were trading in live markets by performing matching like an exchange would.
We covered all of this in the chapter on backtesting, and it should be clear how complex building a good backtester can be. When the backtester isn't very accurate, validating strategy behavior and performance is difficult since it is not possible to be confident of strategy performance based on the backtester results. This makes the design, development, improvement, and validation of trading strategies difficult and inaccurate.
Risk estimates
In the chapter on risk managementhttps://blog.csdn.net/Linli522362242/article/details/122159869, we use the backtester to quantify and measure the different risk measures( Stop-loss,Max drawdown,Position limits, Position holding time, Variance of PnLs, Sharpe ratio,Maximum executions(or trades) per period, Maximum trade size, Volume limits(Involving position changes) ) in a trading strategy and trading strategy parameters to get a sense of what to expect before deploying to live markets. Again, this step requires an accurate backtester, and the lack of one will cause inaccuracies in measuring expected risk limits when strategies get deployed to live markets.
Risk management system
Similar to problems with quantifying and measuring risk estimates for a trading strategy in the absence of a very accurate backtester, it is also difficult to build an optimal risk-management system. Also, we saw in the chapter on risk managementhttps://blog.csdn.net/Linli522362242/article/details/122159869 that we want to not only build a risk management system, but also a system of slowly increasing trading exposure and risk limits after good performance, and lower trading exposure and risk limits following a poor performance(Realistically adjusting risk). Without a good backtester, this aspect of trading strategy development and deployment suffers and causes issues when deployed to live markets as it deviates from historical expectations.
Choice of strategies for deployment
When we have a pool of different possible trading strategies, different trading signal combinations, and different trading parameters, typically, we use the backester to build a portfolio of strategies to deploy to live markets in a way that minimizes risk for the entire portfolio. This step relies on having a good backtester, the lack of which causes live trading strategy portfolios to perform poorly and take more risk than historical simulations would have you believe.
Again, since a good backtester is at the core of this step, without it, live trading strategies and portfolios do not perform as expected. When backtesters vary in their deviations from live trading results for different trading strategies and different trading parameters, this problem can be even worse in the sense that not only do strategies that appear to be profitable in simulations not perform well in live markets, but we might also be missing out on strategies that appear to not be as profitable in simulations but actually might perform quite well if deployed to live markets because the backtester is pessimistic to those specific trading strategies or parameters.
Expected performance
It should be obvious that the major problem with a backtester that suffers from a lot of dislocations from live trading is that performance expectations derived from simulation results do not hold up in live trading. This throws off the signal validation, strategy validation, risk estimate, risk management, and risk adjustment strategies, but it also throws off risk-reward expectations. Since trading strategies do not live up to expected simulation performance, this can often result in the entire algorithmic trading business failing.
Causes of simulation dislocations
Now that we've covered all the issues that an inaccurate backtester can cause in terms of developing, optimizing, and deploying algorithmic trading strategies and algorithmic trading businesses, let's explore common causes of simulation dislocations.
Slippage
Slippage refers to the fact that expected trade prices from simulations, and actual trade prices as realized in live trading, can be different. This obviously can be detrimental to expected performance from algorithmic trading strategies because it is possible, and often likely, that trade prices in live markets are worse than what is expected from simulations. This can be due to historical market data playback issues, underlying assumptions about the latencies within the trading strategy, or the latencies between trading strategy and trading exchange, which we will explore shortly.
Another reason can be due to the market impact, where, with simulations, we try to trade larger sizes than can be traded in live markets without creating a market impact and inciting[ɪnˈsaɪt]引发,刺激 reactions from other market participants, such as removing available liquidity, which exacerbates[ɪɡˈzæsərbeɪt]使恶化,使加剧 trade prices in live markets as compared to simulations.
Fees
One major trading cost is trading fees, which are usually fees per traded share/future contract期货合约/options contract期权合约 levied[ˈlevid]被征收的 by the trading exchange and the broker. It is important to understand what these fees are and account for them in trading strategy performance analysis, otherwise it might lead to false estimates of expected risk versus reward.
It is important to consider the PnL per contract traded to make sure that the strategy covers trading fees and profits after fees, which is especially important for high-volume trading strategies such as HFT(high frequency trading) or market-making algorithmic trading strategies, which typically trade a lot of contracts and have lower PnL per contract-traded ratios than some other strategies.
Operational issues
When deploying algorithmic trading strategies to live markets, it is important to execute the strategy in live markets that are as close to simulation conditions as possible. The key objective is to try to realize the performance observed in backtesting/simulations in a live market. It is important to manually interrupt/intervene in live trading strategies as little as possible, because that can kill algorithmic trading strategies by interfering with, and deviating from, their expected simulated lifetime performance.
Operationally, it can be difficult to fight the temptation[tempˈteɪʃn]诱惑 to interfere with live trading strategies and shut them down early if they are making money, or get scared and shut them down if they are losing money. For automated trading algorithms, which have been backtested extensively, manual intervention is a bad idea because simulated results can't be realized and they affect the expected versus realized实际 profitability of a trading strategy.
Market data issues
Issues with playing back historical market data to trading strategies can become a problem if the market data that trading strategies observed in live trading is different from what is observed in simulations. This can be because of
- differences in the servers used for historical market data capture versus live trading,
- the way market data gets decoded in the historical archiver process versus live market data process,
- issues in how the data gets time stamped and stored,
- or even in the backtester that reads historical data and replays it to the trading strategy.
It is quite clear that if the market data time series is different in simulations versus live trading, then all aspects of algorithmic trading strategy suffer/deviate from historical expectations, and thus, the live trading performance doesn't live up to不符合 the simulation results.
Latency variance
In an algorithmic trading setup, there are many hops[hɑːps] between when the market data first reaches the trading server and when the order flow in response to the new data reaches the trading exchange.
- First, the market data feed handler reads it and decodes it,
- the trading strategy then receives the normalized market data,
- and then the strategy itself updates the trading signals based on the new market data and sends new orders or modifications to existing orders.
- This order flow then gets picked up by the order gateway,
converted to an exchange-order-entry protocol, and
written to the TCP connection with the exchange.
The order finally gets to the exchange after incurring latency equal to the transmission latency from the trading server to the matching engine at the electronic trading exchange. Each one of these latencies needs to be accounted for in backtesting trading strategies, but it can often be a complicated problem. These latencies are most likely not static latency values, but vary depending on a lot of factors, such as
- trading signal and
- trading strategy software implementation,
- market conditions, and
- peak network traffic,
and if these latencies are not properly modeled and accounted for in historical simulations, then live trading strategy performance can be quite different from expected historical simulation results, causing
- simulation dislocations,
- unexpected losses in live trading, and
- impaired[ɪmˈperd]受损的 trading strategy profitability,
- possibly to the point where the strategies cannot be run profitably.
Place-in-line estimates
Since electronic trading exchanges have different possible models for matching algorithms, such as FIFO and pro-rata按比例的,成比例的, if a trading strategy's performance depends on having a good place in the line, that is, other market participants' sizes ahead of the strategy's orders at the same price level, then it is important to accurately simulate that. In general, if the backtester is too optimistic in estimating a trading strategy's order's priority in the limit order book as compared to the rest of the market participants, that is, it assumes our order is ahead of more market participants than it actually is in live markets, this leads to false and inflated expectations of trading strategy performance.
When such trading strategies are deployed to a live market, they often do not realize the expected simulated trading performance, which can hurt the trading strategy profitability. Modeling an accurate place in line is often a difficult problem and requires a lot of research and careful software development to get correct.
Market impact
Market impact refers to what happens when our trading strategy is deployed to live markets as compared to when it is not. This is basically to quantify and understand the reactions of other market participants in response to our order flow. Market impact is difficult to anticipate and simulate, and gets progressively worse the more the trading strategy is scaled up. While this is not a problem when algorithmic trading strategies are first deployed with very small risk exposure, it becomes an issue over time as they are scaled up.
Profitability does not increase linearly as risk is increased. Instead, the rate of increase of profitability slows down as size is increased but risk continues to increase, and that is due to market impact reasons. Eventually, strategies reach a size where large increases in risk still only marginally increase profitability, which is where the strategy has reached the limit of what it can be scaled up to. This is, of course, if we account for market impact when analyzing expected risk versus reward. Here, inaccuracies will always
- end up causing the trading strategy to take a lot more risk for very little extra profit and
- might end up causing a seemingly profitable trading strategy to massively underperform表现严重不佳 when deployed and scaled up in live markets.
调整Tweaking backtesting and strategies in response to live trading
Now that we've discussed the causes and impact of simulation dislocations from live trading performance, let's explore possible approaches/solutions to those problems if the algorithmic trading strategies deployed to live markets do not match th anticipated performance.
Historical market data accuracy
Something that should be obvious at this point is that the quality and quantity of the historical market data available is a key aspect in being able to build a profitable algorithmic trading business. For this reason, most market participants invest a lot of resources in
- building a market data capture and normalization process that is extremely accurate,
- and software implementation that is bug free and able to faithfully[ˈfeɪθfəli]忠诚地,准确地 capture and replay live market data in historical mode to match exactly what algorithmic trading strategies will observe when they are deployed in live markets.
Usually, if trading strategies are not performing in live markets as expected, this is the first place to start. By adding an extensive amount of instrumentation/recording to what market data update trading strategies observe, and comparing what is observed in simulations and live trading, it is relatively straightforward to find and fix underlying issues.
There may be issues in the historical market data recording setup, the live market data decoding and delivery setup, or both. Sometimes, latency sensitive trading strategies have a normalized market data format in live trading that is different from what is available in historical recording by streamlining market data information delivered to live trading strategies to be as compact and as fast as possible, in which case this can be another reason why live market data updates differ from historical market data updates. If issues are discovered in this step, first fix those issues in the historical and/or live market data protocol. Following that, the trading strategy results are recomputed, recalibrated if needed, and then redeployed to live markets to observe whether fixing these issues helps to reduce simulation dislocations.
Measuring and modeling latencies
After confirming that there are no outstanding market data issues, the next step is to look into the underlying latency assumptions in the backtester. In a modern algorithmic trading setup, there are many hops in between the exchange matching engine that generates market data and the trading strategy that receives the decoded and normalized market data, and then between the trading strategy that decides to send the order flow out to the exchange until it is actually received by the exchange matching engine. With modern improvements in server hardware, network switch, network card, and kernel bypass technologies, it is possible to record the timestamps between each of these hops very precisely in nanoseconds and then use those measurements to test the underlying latency assumptions/estimates used in the backtester.
In addition, modern electronic trading exchanges provide a lot of different timestamps that are also measured very precisely in the various hops within their own matching engine setup. These measurements include
- when an order request was received by the trading exchange,
- when it was picked up by the matching engine to be matched
or added to the limit order book, - when the private order notification and public market data update were generated,
- and when the corresponding network packets left the trading exchange infrastructure.
Properly recording these timestamps provided by the exchange, using those measurements to gain insight into the conditions surrounding our orders getting matched, and calibrating the backtester on that basis, can help in addressing simulation dislocations. Each latency measurement between different hops is a distribution of possible values that vary by time, trading instrument, trading exchange, and trading strategy.
Typically, most simulators start with a static latency parameter for each one of these measurements, which is the mean or median of the distributions. If the variance for a specific latency measurement is very high, then a single static parameter no longer suffices[səˈfaɪs]满足……的需求 and at that point one must use a more sophisticated latency modeling approach. One approach can be to use the mean latency as observed in live trading, but add an error term to the latency based on what is observed in live trading, while the more sophisticated approach is to implement features that can capture periods/conditions of higher or lower latencies and dynamically adjust those in the backtester. Some intuitive features would be to use
- the frequency of market data updates,
- frequency of trades,
- or the magnitude and momentum of price moves as a proxy[ˈprɑːksi]代理 for increased latency.
The idea behind this is that during periods of higher activity either due to busy market conditions and large price moves, or when lots of participants are sending a higher-than-normal amount of order flow to the exchange and, in turn, generating a larger-than-normal amount of market data, many of the latency measures are likely to be higher than normal and, in fact, be a function of increased market activity. This also makes sense because, during these periods, the trading exchange has to process more order flow, perform more matching per order flow, and generate and disseminate[dɪˈsemɪneɪt]散布,传播 more market data for every order flow, so there are more delays due to processing times. Similarly, on the algorithmic trading strategy side, more market data means more time to read, decode, and normalize incoming market data updates, more time to update limit order books and update trading signals, more order flow generated to deal with the increased market activity, and more work done by the order gateway to deal with the increased order activity.
Modeling dynamic latencies is a difficult problem to solve in a backtester, and most sophisticated participants invest a lot of resources trying to get it right in addition to trying to build a trading infrastructure and trading strategies that have lower latency variance to begin with. To summarize this section, if simulation dislocations are associated with errors in latency assumptions/modeling, then the first step is to collect as many accurate measurements between each hop in the trading system and trading exchange as possible and build intelligence to faithfully reproduce those in historical simulations.
Improving backtesting sophistication
In the previous section, we looked at the importance of understanding and modeling latencies in an algorithmic trading setup correctly when backtesting trading strategies. If after carefully understanding, accounting for, and modeling latency variances in the algorithmic trading setup in historical simulations and redeploying the algorithmic trading strategy to live markets, we are still noticing simulation dislocations that are causing a deviation in strategy performance in live markets from what is expected, we can look into further backtesting sophistication.
Different asset classes come with their own set of matching rules and complications. Dark pools, hidden liquidity, price improvements, hidden counter parties, and a lot of other factors can end up creating simulation dislocations and ultimately cause an algorithmic trading strategy to fail. Understanding all these rules, implementing them in software, and building accurate simulations on top of that is a very difficult problem to solve, but can often be the difference between success and failure in the algorithmic trading business.
Adjusting expected performance for backtester bias
We've looked at a lot of possible avenues for finding and fixing issues in the simulation and historical market data playback framework. If we are still observing differences in trading strategy performance in live markets as compared to simulations, then another possible solution to explore would be to adjust the expected performance results as obtained from simulations to account for the backtester bias回测偏差.
As we discussed before, the backtester bias can be optimistic or pessimistic in nature and can be a constant bias or a bias that varies by trading strategy type, by strategy parameters, or by market conditions. If the bias can be isolated to be constant for a specific strategy type and strategy parameters, then it is able to collect simulation dislocation results from live trading results and organize them per strategy and per strategy parameter set. These expected dislocation values can then be used with the simulated results to estimate true live trading results. For example, if an algorithmic trading strategy with specific parameters always performs 20% worse in live trading as compared to simulation results because of simulation dislocations, we can account for that, reduce its simulated results by 20%, and re-evaluate it. We can take this estimation methodology one step further and try to model the magnitude of backtester optimism/pessimism as a function of traded volume and market conditions, such as how busy the market is or how much the prices changed.
In this manner, it is possible to build a system that takes simulated results for trading strategies and then takes live trading results for the same strategies and tries to quantify the simulation dislocations and provide estimates of true expected live trading performance. These methods of adjusting expected live trading performance are not ideal; they require feedback from running trading strategies in live trading, which might cause losses and, at the end of the day, is just an estimation. Ideally, we want a backtester capable of providing accurate simulation results, but since that is an extremely difficult and sometimes impossible task, this estimation method is a good middle ground for dealing with simulation dislocations and continuing to build up and manage an algorithmic trading business.
Analytics on live trading strategies
Another solution to dealing with live trading performance deviating from the expected simulation performance is to have sophisticated analytics on live trading strategies. This is another way of saying that instead of relying completely on backtesting performance and behavior, you can also invest in adding enough intelligence and sophistication directly to live trading strategies to reduce the likelihood of simulation dislocations derailing[dɪˈreɪlɪŋ]出轨 an algorithmic trading business. This, again, is an imperfect approach to solving the problem, but can be a good alternative to help with limitations and errors in backtesters. The idea is to deploy trading strategies to live markets with very small exposure[ɪkˈspoʊʒər]风险很小的, collect statistics on each strategy action, and properly instrument and collect statistics on why those decisions were made.
Then we resort to an extensive Post Trade Analytics (PTA) framework to dig through these strategy action records and classify winning and losing positions and statistics on strategy actions that led to these winning and losing positions. Often, performing this kind of PTA on trading performance from live trading can reveal a lot of insight about problems/limitations for that particular trading strategy. These insights can be used to guide the development and improvement of the algorithmic trading strategy and improve profitability over time. In many ways, this boils down to the approach of starting trading strategies at very small risk exposures with intuitive parameters and using feedback from live trading to improve the strategy's performance.
This is not a perfect approach, since it requires the trading strategies to be simple enough where they can be run under live trading conditions with easily understood parameters, in addition to the fact that we might have to run a trading strategy that is not profitable in live market conditions for a short time, while accruing[əˈkruːɪŋ] losses that we don't want.
Continued profitability in algorithmic trading
In the first half of this chapter, we looked at研究了 what common issues you can expect遇到 when deploying algorithmic trading strategies that have been built and calibrated in simulations and appear to be profitable. We discussed the impact and common causes of simulation dislocation, which cause deviation in trading strategy performance when deployed to live trading markets. We then explored possible solutions to dealing with those problems and how to get algorithmic trading strategies off the ground如何制定 and start scaling up safely开始安全地扩大规模 to build a profitable algorithmic trading business. Now, let's look at the next steps after getting up and running with the algorithmic trading strategies in live trading markets. As we mentioned before, live trading markets are in a constant state of evolution, as participants enter and exit markets and adapt and change their trading strategies.
In addition to the market participants themselves, there are numerous global economic and political conditions that can influence price movements in global and/or local asset classes and trading instruments. It is not enough to just be able to set up an algorithmic trading business; it is also mandatory[ˈmændətɔːri]代理人 to be able to adapt to all of these possible changing conditions and market risk and continue to stay profitable. That is an extremely tough goal; over time, previously profitable and sophisticated market participants have had to shut down their trading businesses and exit the market, making algorithmic and quantitative trading one of the most challenging businesses out there. In this section, let's explore what causes winning trading strategies to die out after first being profitable.
We will explore solutions that can help us to maintain and improve trading strategy profitability after the initial deployment to live trading markets. Finally, we will wrap up this chapter by discussing adapting to changing market conditions and market participants, that is, dealing with the ever-evolving不断发展的 nature of the algorithmic trading business and how to work on building an algorithmic trading business that survives for a very long time.
Profit decay in algorithmic trading strategies
First, we need to understand what factors cause trading strategies that were initially profitable to slowly decay in profitability and eventually no longer be profitable at all. Having a good understanding of what possible factors can cause a currently profitable algorithmic trading business to deteriorate[dɪˈtɪəriəreɪt]恶化,变坏 over time can help us put checks and re-evaluation mechanisms in place to detect these conditions and deal with them in time in order to maintain profitability of the algorithmic trading business. Now let's look at some of the factors involved in profit decay for algorithmic trading strategies.
Signal decay due to lack of optimization
The signals used in the trading strategy are obviously one of the key aspects that drive trading strategy performance. Trading signals come with a maintenance aspect that requires them to be constantly re-evaluated and re-adjusted to stay relevant/profitable. This is partially because trading signals with constant parameters cannot perform equally well through different market conditions and require some tweaking or adjustment as market conditions change.
Sophisticated market participants often have elaborate[ɪˈlæbəreɪt]精心制作的 optimization/re-fitting setups meant to continuously adjust and adapt trading-signal parameters to deliver maximum trading performance and advantages. It is important to not just find trading signals that are performing well over recent days, but to also set up a systematic optimization pipeline to adapt trading signals to changing market conditions to keep them profitable.
Signal decay due to absence of leading participants
A lot of trading signals capture specific market participant behavior and predict future market price moves.
A simple example would be trading signals that try to detect order flow coming from high-frequency trading participants and use that to get a sense of what portion of available liquidity is from very fast participants with the ability to add and remove liquidity at prices very fast, sometimes faster than other participants can react and trade against.
Another example would be trading signals trying to capture participant behavior in related markets, such as cash markets or options markets现货市场或期权市场, to gain an advantage in other related markets, such as futures markets, for similar trading instruments. Sometimes, if a large amount of market participants that these trading signals capture and leverage exit the market, become more informed, or are able to disguise their intentions better, then these trading signals that depend on these participants no longer retain their predictive abilities and profitability. Since market participants and market conditions change all the time, signal decay due to absence of market participants is a very real and very common occurrence and something that all profitable market participants have to account for and deal with.
This involves having teams of quantitative researchers always searching for new predictive trading signals that are different from existing trading signals to counteract[ˌkaʊntərˈækt]抵制,抵消 the possibility of currently profitable trading signal decay. The signal-parameter optimization aspects we covered in the previous section also help to alleviate[əˈliːvieɪt]减轻,缓和 this problem by using existing signals but with different parameters to get information from new participants, as information gleaned from existing participants decays over time.
Signal discovery by other participants
In the same way that we are continuously in the process of optimizing existing trading signal parameters as well as searching for new trading signals, all market participants are also searching for new trading signals. Often other market participants also discover the same trading signals that our trading strategies are using to be profitable. This can cause the market participants to react in a couple of different ways, one way would be to change their trading strategy's order flow to disguise[dɪsˈɡaɪz]掩饰 their intent and make the trading signal no longer profitable for us.
Another reaction can be that these participants start using the same trading signal to run trading strategies very similar to our own, thus crowding the market with the same trading strategy and reducing our ability to scale up the trading strategy, leading to reduced profitability. It is also possible for the market participant to leverage better infrastructure or be better capitalized, and we can lose our trading edge completely and get squeezed out of the market. While there is no real way to ban other participants from discovering the same trading signals that are being used in our algorithmic trading strategies, the industry practices have evolved over time to reflect the extremely secretive nature of the business, where firms typically make it difficult for employees to go work for a competitor. This is done through non-disclosure agreements (NDAs), non-compete agreements (NCAs), and strictly monitoring the development and use of proprietary trading source code.
The other factor is the complexity of the trading signals. Typically, the simpler a trading signal is, the more likely it is to be discovered by multiple market participants. More complex trading signals are less likely to be discovered by competing market participants but also require a lot of research and effort to discover, implement, deploy, monetize[ˈmɑːnɪtaɪz]货币化, and maintain. To summarize this section, losing the trading edge when other participants discover the same signals that are working for us is a normal part of the business, but there is no direct solution to this problem, other than trying our best to keep discovering new trading signals ourselves to stay profitable.
Profit decay due to exit of losing participants
Trading is a zero-sum game; for some participants to make money, there must be less informed participants that lose money to the winning participants. The problem with this is that participants that are losing money either get smarter or faster and stop losing money, or they continue losing money and eventually exit the market altogether, which will hurt continued profitability of our trading strategies and can even get to a point where we cannot make any money at all. If our trading strategies are making money by trading against these less informed participants, and they either become better informed and stop losing money or they leave the market, either we lose our trading signal advantage that relied on their behavior, or the competition gains edge on us causing our trading strategies to go from being profitable to losing money. Intuitively, since no participant that is losing money continuously is likely to continue trading, it seems likely that this is a business that is eventually going to die out for everyone.
This doesn't happen in practice because large markets are composed of a very large number of participants with different trading strategies, different trading horizons不同交易期限(e.g. Short-term,Medium-term,Long-term), and different information. Also, participants exit the markets and new participants enter the markets every day, creating new opportunities for all participants to capitalize on. To summarize, since market participants are continuously evolving and new participants enter the market and existing participants leave the market, it is possible for us to lose those participants that provide the trading signals that we use in our trading strategies. To deal with this, we have to constantly search for new trading signals and diversify trading signals and strategies to capture more market participants' intentions and predict market price moves.
Profit decay due to discovery by other participants
We discussed the possibility of and the impact of other market participants discovering our trading signals and using the same signals that our trading strategies utilize to make money. Similar to other market participants discovering the same trading signals that our trading strategies use and hurting our profitability, it is possible for other market participants to discover our order flow and strategy behavior and then find ways to anticipate and leverage our trading strategy's order flow to trade against us in a way that causes our trading strategies to lose money.
Other ways other market participants can discover our order flow and anticipate market price moves in different asset classes or other trading instruments, perhaps for stat arb(Statistical arbitrage or StatArb is in some way similar to pairs trading that takes offsetting positions采取抵消头寸 in co-linearly related products(就是买一个产品的头寸,卖掉另外一个线性相关产品的头寸,价格上相等)https://blog.csdn.net/Linli522362242/article/details/121896073)
or pair-trading strategies(pair trading配对交易—mean reversion is based on the correlation between two instruments. If a pair of stocks already has a high correlation and, at some point, the correlation is diminished减弱, it will come back to the original level (correlation mean value). If the stock with the lower price drops, we can long做多 this stock and short做空 the other stock of this pairhttps://blog.csdn.net/Linli522362242/article/details/121721868
) or cross-asset strategies. This can lead to reduced profitability or it can worsen to a point where it is no longer feasible to continue running the specific algorithmic trading strategy. Sophisticated market participants often invest a lot of thought, design, and resources to make sure that the algorithmic trading strategy behavior does not immediately give away the strategy's behavior in a way that can be used by other market participants to hurt our trading profitability.
This often involves the use of GTC orders(Good ’til canceled (GTC) describes a type of order that an investor may place to buy or sell a security that remains active until either the order is filled or the investor cancels it. Brokerages will typically limit the maximum time you can keep a GTC order open (active) to 90 days.) to build queue priority in FIFO markets,
- using icebergs to disguise[dɪsˈɡaɪz]掩饰 the true liquidity behind orders,
- using stop orders止损订单 to be triggered at specific prices ahead of time,
- using Fill and Kill or Immediate or Cancel orders to mask the true liquidity behind orders being sent to the exchange, and complicated order-execution strategies to hide the trading strategy's true intention.
Obviously, trying to hide intentions from other market participants can be taken too far, as we saw in the case of Spoofing(Spoofing[ˈspuːfɪŋ]电子欺骗 typically refers to the practice of entering orders into the market that are not considered bonafide[ˌboʊnə ˈfaɪdi]真正的,真实的. A bonafide order is one that is entered with the intent of trading. Spoofing orders are entered into the market with the intent of misleading other market participants, and these orders were never entered with the intent of being executed.), which is an illegal algorithmic trading practice. In summary, to use sophisticated trading strategies in a very competitive and crowded market, the strategy implementation can often be a lot more complex than it needs to be for the purposes of mitigating information leak减少信息泄漏 and reduced profitability.
Profit decay due to changes in underlying assumptions/relationships基本假设/关系
All trading signals and trading strategies are built on top of certain underlying assumptions, such as assumptions about market participant behavior, and assumptions about interactions and relationships between different asset classes and different trading instruments. When we built basic trading strategies, we relied on the underlying assumptions that parameters such as 20 days and 40 days were correct for our trading instrument. With sophisticated trading strategies, such as volatility adjusted trading strategies, economic-release-based trading strategies, pair-trading strategies, and statistical arbitrage strategies, there are more underlying assumptions about the relationship between volatility measures and trading instruments, the relationship between economic releases and impact on economy, and price moves in trading instruments.
Pair-trading and statistical arbitrage trading strategies also make assumptions about the relationship between different trading instruments and how it evolves over time. As we discussed when we covered statistical arbitrage trading strategies, when these relationships break down, the strategies no longer continue to be profitable. When we build trading signals and algorithmic trading strategies, it's important to understand and be mindful of the underlying assumptions that the specific trading signals and the specific trading strategies depend on to be profitable. Market conditions and participants change all the time, hence it is possible that the assumptions that were true when these trading strategies were first built and deployed to live markets no longer hold true不再适用 during certain times, or might not hold true moving forward.
When this happens, it is important to have the ability to detect, analyze, and understand what strategies will not perform as expected. It's also important to have a diverse set of trading signals and trading strategies. If we don't have enough diverse trading signals and strategies with non-overlapping underlying assumptions, it is possible that trading can get shut down completely. And if the assumptions are never true after that, it could be the end of the algorithmic trading strategy business. To summarize, the only way to deal with a situation where the trading strategies' underlying assumptions no longer hold is to have the ability to detect and understand such periods, and have a diverse set of trading signals and strategies capable of running through different kinds of market conditions and changing participants.
Seasonal profit decay
In the previous section, we talked about how algorithmic trading strategies have many underlying assumptions. Seasonality, which is a concept we covered in one of our chapters, is an assumption that dictates a trading strategy's profitability. For a lot of asset classes, their price moves, volatility, relationships with other asset classes, and expected behavior vary quite predictably. Trading signals and trading strategies need to account for these differences due to seasonal factors and adjust and adapt accordingly; without that, the profitability can vary over time and might not live up to the expected performance. Properly understanding the seasonality factors involved and the impact on the trading strategy performance is important when building and running a long-term algorithmic trading strategy business.
To avoid seasonal profit decay, sophisticated market participants have special trading signals and strategies in place to detect and adapt to seasonal market conditions and relationships between different contracts and trade profitably through all the different seasonal trends. Seasonal profit decay is a normal part of trading strategies that deal with asset classes and/or trading instruments that have seasonal trends in behavior and cross-asset relationships, and it is important to collect large amounts of data and build analytics to understand and manage seasonal trends to maximize profitability.
Adapting to market conditions and changing participants
Now that we've discussed all the different factors that cause the profitability of algorithmic trading strategies to decay over time, or because of changes in market participants' behavior or market conditions, in this section we will go over possible approaches and solutions to handling these conditions and maintaining the long-term profitability of algorithmic trading strategies.
Building a trading signals dictionary/database
In the previous section, we discussed the factors that causes profitable trading strategies to die, which include because the predictive power of trading signals died out over time, either due to lack of parameter optimizations, discovery by other market participants, violations of underlying assumptions, or seasonal trends. Before we explore optimizing trading signals and what that pipeline looks like, one component that is an important part of any quantitative research platform is called the trading signals dictionary/database. This component is a large database containing statistics of different trading signals and different trading signal parameter sets over years of data.
The statistics that this database contains are primarily ones to capture the predictive abilities of these signals over their prediction horizon. Some simple examples of such metrics can be the correlation of the trading signal value with the price movements in the trading instrument which this trading signal is meant for. Other statistics can be variance in the predictive power over days, that is, how consistent this trading signal is over a set amount of days to check whether it varies wildly[ˈwaɪldli]失控地,紊乱地,剧烈地over time.
In this database, there can be one entry per day or multiple entries per day for different time periods for every
In a lot of ways, having access to a comprehensive[ˌkɑːmprɪˈhensɪv] 综合性的,全面的 trading signal dictionary/database allows us to quickly detect changing market conditions/participants by comparing the trading signal performance individually across training and testing history to see whether it is deviating from historical expectations. It also helps us to adapt to changing market conditions/participants by letting us quickly query the database for historical signal performance to see what other signals would have helped or worked better. It also answers the question of whether the same trading signal with same trading instrument input, but with different trading signal parameters, would have done better than the current parameter set being used in live trading.
Investing in setting up a research-platform component that can compute results across different trading signals, signal instrument input, signal parameters, signal prediction horizon, time periods over years of tick data多年分期数据的时间段的结果, and then storing it in an organized manner can help you to understand and handle a lot of the factors that cause trading-signal-profit decay in algorithmic trading strategies deployed to live markets and facing changing market conditions.
Optimizing trading signals
In section, we discussed that trading signals with static input cannot deliver profitable results consistently, given that market conditions and market participants evolve over time. In the previous section, we saw how having a large quantitative system that can continuously compute and store results for different trading signals over time can help us to deal with this. Another component that should be part of a sophisticated algorithmic trading business' arsenal[ˈɑːrsənl]武器,军火库 is a data-mining/optimization system capable of taking existing trading signals, building a very large number input instrument and parameter combinations, and then trying to optimize over that very large population of similar, but slightly different, trading signals of different prediction horizons over certain time periods and summarizing the results to find the best one. In essence, this is similar to the trading signals dictionary/database setup we discussed before, but the purpose here is to build and try variations of signals that the researcher does not need to provide manually and then find better variants than what they can come up with intuitively/ manually.
This is often necessary to bridge the gap between what trading signals and parameters researchers believe should work intuitively and what is optimal and also helps us to discover trading signals, input, and parameter combinations that might otherwise be overlooked被忽略的. This system can involve relatively straightforward methods, such as grid searching over permutations of different signals and parameter values, or can be quite advanced and involve optimization techniques, such as
- linear optimization,
- stochastic gradient descent,
- convex optimization,
- genetic algorithms遗传算法,
- or maybe even non-linear optimization techniques.
This is a very complex system that has many sub-components, such as
- a trading-signals and
- parameters-permutation generator,
- signal evaluator,
- quantitative measures of signal predictive abilities,
- signal performance summary algorithms,
- grid-searching methods,
- possibly advanced optimization implementations and components to analyze and visualize summary statistics for trading signal performance.
This is, however, an important optimization platform/system that will help prevent trading signal decay after being deployed to live trading markets, by letting us proactively adjust and adapt to changing market conditions and maintain profitability, and can often increase profitability over time by helping us to find better variants of trading signals than the ones we started with. Advanced market participants invest in massively scalable cloud/cluster computing systems to run these optimizations around the clock to look for better signals.
Optimizing prediction models
Most trading strategies in modern electronic trading exchanges employ more than a single trading signal, generally using at least a handful of trading signals, all the way up to hundreds of trading signals inside a single trading strategy. These trading signals interact with each other in numerous complex ways and it is often difficult to understand, analyze, and optimize these interactions. Sometimes these trading signals interact with each other through complex machine learning models, which makes it even more difficult to intuitively understand all the different interactions possible.
Similar to how we analyze trading signals over a larger search space using complex principles and methods from linear algebra, calculus, probability, and statistics, we also need a similar system for trading strategies. This system has to be capable of testing over a huge space of possible interactions between different trading signals and optimizing these interactions to find the optimal trading signal combination models. A lot of the possible techniques that can be used to optimize trading signals can also sometimes be directly used to optimize combinations of trading signals. However, the only thing to understand is that the size of the search space here is a function of how many trading signals are being combined in the final trading model.
Another consideration is the optimization method used to optimize the prediction model, which is a combination of individual trading signals. For complex methods with a lot of trading signals, this complexity can increase exponentially and become unsustainable very quickly. Sophisticated quantitative trading firms will use a combination of large cloud/cluster-computing systems, smart parallelization pipelines, and super-efficient optimization techniques to optimize their prediction models continuously with large datasets. Again, this is all in an effort to deal with changing market conditions and trading participants, and always have the optimal signals and signal combinations possible to maximize trading profitability.
Optimizing trading strategy parameters
Remember that a trading signal has input parameters that control its output/behavior. Similarly, prediction models, which are combinations of trading signals, have weights/coefficients/parameters that control how trading signals interact with each other. Finally, trading strategies also have many parameters that control
- how trading signals, predictive models, and execution models work together to send the order flow to the trading exchange in response to incoming market data,
- how positions are initiated and managed,
- and how the actual trading strategies behave. This is the final finished trading strategy that gets backtested and deployed to live trading markets.
Let's discuss this in the context of a trading strategy we're already quite familiar with. For example, in the trading strategies we saw in t5_Sophisticated Algorithmic Strategies(MeanReversion+APO+StdDev_TrendFollowing+APO)_StatArb统计套利_PnL_Linli522362242的专栏-CSDN博客 , Sophisticated Algorithmic Strategies, there were static parameters as well as volatility-adjusted dynamic parameters that controlled thresholds for buy/sell entries, thresholds to control over-trading(APO, overbought or over sold), thresholds to lock in profits/losses, parameters that controlled position increase/decrease, and parameters/thresholds that controlled the strategy's trading behavior as a whole. As you can imagine, different trading strategy parameter sets can produce vastly different trading results in terms of PnLs and also in terms of risk exposure that the trading strategy is willing to take, even if the trading signals or predictive models themselves do not change.
Another way of thinking about this is that individual trading signals provide opinions about future market price moves, while predictive models combine many different trading signals with different opinions and produce a final opinion about future/expected market price moves. Finally, it is the trading strategy that takes these predictions and converts that into the outgoing order flow to be sent to the exchange to perform trades and manage positions and risk in a way that converts predicted price moves into actual dollars, which is the final objective of all algorithmic/quantitative trading strategies.
Trading strategy parameters are optimized using similar infrastructures, components, and methods to optimize trading signals and predictive models, the only difference is that here the optimization objectives are PnL and risk instead of predictive ability, which is used to evaluate trading signals and predictive models. Continuously evaluating and optimizing trading strategy parameters is another important step in adapting to changing market conditions/participants and staying consistently profitable.
Researching new trading signals
We've discussed in considerable detail the impact and causes of profit decay for existing trading signals and importance of continuously searching for new sources of trading edge/advantage in terms of researching and building new trading signals. As mentioned, a lot of market participants have entire teams of quantitative researchers implementing and validating new trading signals full-time to achieve this. Searching for new trading signals, or alpha, is an extremely difficult task, and is not a well-structured or well-known process.
Trading signal ideas are brainstormed from live trading analytics, by inspecting periods of losses, or by inspecting market data and interactions between market data, market participants, trading signals, and trading strategies during those times. Based on what is observed and understood from this inspection/analysis, new trading signals are conceptualized based on what appears like it would have helped avoid losing positions, decrease the magnitude of losing positions, help produce more winning positions, or increase the magnitude of winning positions. At this point, the new trading signal is just an idea with no quantitative research or proof to back it up. The next step is to implement the trading signal, then the values output by the trading signals are tweaked and validated to understand its predictive abilities similar to what we discussed in the section on trading signals database.
If the newly-developed trading signal seems to show some potential/predictive abilities, it passes the stage of prototyping and is forwarded to the trading signal optimization pipeline. Most trading signals never make it past the prototype stage, which is part of what makes developing new trading signals extremely challenging. That is often because what makes intuitive sense does not necessarily translate into useful/predictive trading signals. Or the newly-conceptualized trading signal turns out to be quite similar in predictive abilities to already-developed signals, in which case it is dropped since it doesn't offer any new predictive abilities. If it makes it to the optimizing step, then we find the best variants of the newly-developed trading signal and they are forwarded to the step of being added to predictive models. Here, it interacts with other pre-existing trading signals. It might take some time and many iterations before we find the correct method to combine the new trading signal with other predictive trading signals to find a final predictive model that is better than any other. After that step, the new trading signal is used in a final trading strategy with strategy parameters that undergo经历,经受 another round of evaluation and optimization before the final evaluation, where we try to determine whether the addition of the new trading signal improves the profitability of our trading strategies.
We saw how much time and resources need to be invested from brainstorming a new trading signal all the way to making it into a final trading strategy where it can improve profitability. It should be obvious that new trading signals have to pass many intermediate validation and optimization stages, compete with other pre-existing and well-known trading signals, and then interact with other trading signals in a way that improves PnLs by adding new value to the trading strategy's ability to trade profitability. In many ways, new trading signals have to go through a survival pipeline very similar to evolution and natural selection – only the best and fittest trading signals survive to make it to live trading strategies, and others die out. This is what makes developing new trading signals so difficult and a task with a very low probability of success. However, researching new trading signals is mandatory[ˈmændətɔːri]强制性的,义务的 for all algorithmic trading business to compete and stay profitable, making the best quants the most sought-after[ˈsɔːt æftər]受欢迎的,很吃香的 employees in all algorithmic/quantitative trading businesses in the industry.
Expanding to new trading strategies
Similar to why it's important to continuously research and generate new trading signals to stay competitive and build an algorithmic trading business that stays profitable for a long period of time, effort must be made to build new trading strategies that add value to the trading strategies that currently exist and are being run in live markets. The idea here is that since trading strategy profitability is affected by a lot of factors, ranging from trading signal and trading strategy decay, improvements made by competing market participants and changes in market conditions that affect underlying assumptions for certain strategies may no longer hold true. In addition to continuously optimizing existing trading strategy signals and execution parameters, it's also necessary to invest resources in adding new, uncorrelated trading strategies that make money in the long run but perform differently. These new strategies should counteract the possibility that some trading strategies will go through periods of reduced profitability or diminishing profitability due to market conditions or seasonal aspects.
Similar to researching and building new trading signals that interact with other trading signals to add non-overlapping predictive powers, we need to build new trading strategies that interact with other pre-existing trading strategies to add non-overlapping sources of profit. It is important that newly-developed trading strategies make money during periods where other trading strategies might be losing money, and that newly-developed trading strategies don't also lose money when other trading strategies are losing money. This helps us to build up a diverse pool of trading strategies that rely on different trading signals, market conditions, market participants, relationships between trading instruments, and seasonal aspects. The key is to build a diverse pool of available trading strategies that can be deployed to live markets in parallel with the objective of having enough intelligent trading strategies running. This helps in dealing with changing market participants/conditions, which can be handled better under the assumption that since the trading strategies are based on different signals/conditions/assumptions, it is unlikely for all of them to decay simultaneously, thus reducing the probability of significant profit decay and of complete shut-down of the algorithmic trading business.
Trading strategies that we've covered in previous chapters that complement each other include trend-following strategies combined with mean-reversion strategies, since they often have opposing views on markets that are trending/breaking out. A slightly less intuitive pair would be pairs-trading and stat-arb trading strategies, since one relies on a co-linear relationship between different trading instruments holding and the other relies on a co-related lead-lag relationship holding between different trading instruments. For event-based trading strategies, it is better to deploy them simultaneously with their trend following as well as mean reversion bets. The more sophisticated market participants usually have combinations of all of these trading strategies with different trading signals and parameters deployed to different asset classes over multiple trading exchanges. Thus, they maintain an extremely diverse range of trading exposure交易风险 at all times. This helps to deal with issues of profit decay in trading signals and trading strategies, and optimize risk versus reward, but we will explore that more in the next section.
Portfolio optimization
In the previous section, we discussed the advantages of having a diverse set of trading strategies that rely on different trading signals. Here, each trading strategy is profitable by itself, but each one's performance is slightly different depending on market conditions, market participants, asset class, and time periods, which are, to a large extent在很大程度上, un-correlated to each other. To recap, the benefits are greater adaptability to changing market conditions/participants and a better risk-versus-reward profile风险与回报情况 for the entire portfolio. This is because all strategies do not lose money simultaneously, which would lead to very large drawdown回撤 across the entire portfolio of trading strategies deployed to live trading markets. Say we have a diverse set of trading strategies, how do we decide how much risk to allocate to each trading strategy? That is a field of study known as portfolio optimization, which has entire books dedicated to understanding the different methods involved.
Portfolio optimization is an advanced technique for algorithmic/quantitative trading, so we won't cover it in too much detail here. Portfolio optimization is the technique of combining different trading strategies with different risk-reward profiles together to form portfolios of trading strategies which, when run together, provide optimal risk-reward for the entire portfolio. By optimal risk-reward, we mean it delivers maximum returns while trying to minimize the amount of risk taken. Obviously, risk versus reward is inversely proportional, so we try to find the optimal reward for the amount of risk we are willing to take and then use the portfolio allocation that maximizes the total reward of the portfolio while respecting the maximum risk we are willing to take across the portfolio. Let's look at some common portfolio-optimization methods, and observe how allocation varies for different allocation methods.
Note that implementation details of different portfolio allocation techniques have been omitted here for brevity's sake, but if you are interested then you should check out https://github.com/sghoshusc/stratandport for a project that implements and compares these different methods. It uses mean-reversion, trend-following, stat-arb, and pairs-trading strategies applied to 12 different futures contracts and then builds optimal portfolios using the methods we've discussed here. It uses python3 with the cvxopt package to perform convex optimization for markowitz allocation and scikit learn for the regime predictive allocation and matplotlib for visualization purpose.
Portfolio optimization---Uniform risk allocation
Uniform risk allocation is the easiest method of portfolio allocation/optimization to understand. It basically says we take the total amount of risk we are allowed to or willing to take across the entire portfolio, and distribute it equally among all available trading strategies. Intuitively, this is a good starting point or a baseline allocation method when we don't have a historical performance record for any of the trading strategy, since nothing has been deployed to live trading markets, but in practice this is rarely ever used.
Portfolio optimization---PnL-based risk allocation
PnL-based risk allocation is probably the most intuitive portfolio allocation/optimization technique. It says to start all available trading strategies with an equal amount of risk when we have no live trading history. Then, as time goes on, we rebalance the portfolio-allocation amounts based on the average performance of each trading strategy.
Let's say we want to rebalance our portfolio of trading strategy every month. Then at the end of every month, we look at the average monthly PnLs of every trading strategy we have in our portfolio and for the next month, every trading strategy gets risk proportional to its average monthly performance, the best performers get the most risk and the worst performers get the least risk allocated to them. This makes intuitive sense and is often how a portfolio allocations are performed. It uses historical performance as a proxy for future performance, which obviously isn't always true but is a good start.
It, however, does not factor in that different trading strategies might be taking different kinds of risks, and a safer trading strategy might get less risk allocated to it in favor of more volatile trading strategies. This allocation method also does not take correlation of returns between different strategies into account while allocating risk to different trading strategies, which can end up causing very high volatility for the portfolio returns.
The interesting point here is that eventually the strategy with the best historical performance ends up with the majority of the risk allocation. Also, strategies that haven't been performing as well as their peers gradually have their risk cut down to a very small amount and often don't recover from there.
Portfolio optimization---PnL-sharpe-based risk allocation
PnL-sharpe-based risk allocation is a step ahead of PnL-based risk allocation. It uses the average PnLs normalized by historic standard deviation of returns to penalize trading strategies that have large PnL swings, also known as very high volatility returns.
This allocation method solves the problem of avoiding the construction of a high-volatility portfolio. But it still does not account for the correlation of returns between different trading strategies, which can still end up causing us to construct a portfolio where the individual trading strategies have good risk-adjusted PnLs but the portfolio as a whole is highly volatile.
The trading strategy with the best performance still makes the most money, similar to what we saw in the individual PnL-based allocation. However the other trading strategies still get a decent[ˈdiːsnt] portion相当一部分 of the total allocation amount. This is because when we factor for risk in our allocation method, even strategies that make a lot of money don't necessarily end up with large allocations because the volatility in their returns also increases with their PnLs.这是因为当我们在分配方法中考虑风险时,即使是赚很多钱的策略也不一定最终会获得大量分配,因为它们的回报波动性也会随着它们的 PnL 增加而增加.
Portfolio optimization---Markowitz allocation
The Markowitz portfolio allocation is one of the most well-known portfolio-allocation approaches in modern algorithmic/quantitative trading and is based on modern portfolio theory. The idea here is to take the co-variance between the returns of all the trading strategies in our portfolio and account for that when allocating risk to individual trading strategies to minimize portfolio variance while maximizing portfolio returns. It is a convex optimization problem and has many well-known and well-understood techniques to solve. For a given level of portfolio variance, it can find the best allocation scheme to maximize portfolio returns by building what is known as an efficient frontier curve, which is the curve of optimal allocations for the trading strategies in the portfolio for different levels of risk. From there, as our risk appetite grows or shrinks, and as more strategy results are available as more trading days are seen, it is straightforward to rebalance the portfolio by using the re-adjusted efficient frontier.
For Markowitz allocation, we can state the following:
- Allocation seeks to maximize diversity of the different trading strategies in the portfolio, by ensuring that strategies with uncorrelated returns have risk allocated to them.
- While in other allocation methods, the risk allocation for strategies that have poor performance would have dropped close to 0, here even losing strategies失败的策略 have some allocation assigned to them. This is because the periods in which these losing strategies make money offsets抵消 periods where the rest of the portfolio loses money, thus minimizing overall portfolio variance.
Portfolio optimization---Regime Predictive allocation
Regime Predictive allocation is a technique that has been used by some advanced participants in recent years and is still something that is actively being researched. This studies the performance of different trading strategies as a function of different economic indicators and then builds machine learning predictive models that can predict what kinds of trading strategies and what product groups are most likely to do well given current market conditions. To summarize, this allocation method uses economic indicators as input features to a model that predicts trading strategies' expected performance in the current market regime and then uses those predictions to balance allocations assigned to different trading strategies in the portfolio.
Note that this method is still able to allocate the largest risk to the best-performing strategy and reducing allocation on strategies that are performing poorly. This will make more sense when we compare it to all the different allocation methods covered in the following plot: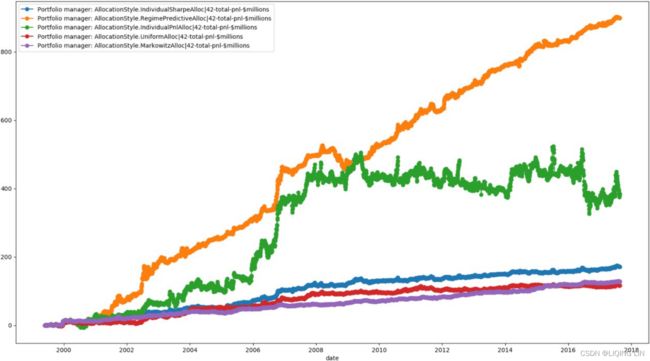
When we compare the different allocation methods next to each other, we can make a couple of observations. The first is that
- the Markowitz allocation method seems to be the one with the least variance and steadily rises up.
- The Uniform allocation method performs the worst.
- The Individual PnL-based allocation method actually has very good performance, with a cumulative PnL of around $400,000,000. However, visually we can observe that it has very large variance because the portfolio performance swings around a lot, which we intuitively expected because it doesn't factor for variance/risk in any way.
- The regime-based allocation method by far outperforms all other allocation methods with a cumulative PnL of around $900,000,000. The regime-based allocation method also seems like it has very low variance, thus achieving very good risk-adjusted performance for the portfolio.
Let's look at the different allocation methods portfolio performance by comparing daily average portfolio performance with daily standard deviation of portfolio performance in the plot. We do this to see where each strategy-allocation method lies on the risk versus reward curve, which we could also extend to find the efficient frontier, as shown here:
We can make the following observations from the preceding plot:
- The avg-daily-PnLs and daily-risk are in $1,000 units.
- We immediately see that Markowitz allocation has the minimum possible portfolio risk/variance with an avg-PnL of $25,000 and risk of $300,000.
- The Uniform risk allocation method has lowest portfolio avg-PnL of roughly $20,000 but higher risk of $500,000.
- The individual PnL allocation has a very large avg-PnL of $80,000 but with much higher risk of $4,700,000, which would likely make it unusable in practice.
- The Regime predictive allocation method has a very high avg-PnL of $180,000 and relatively low risk of $1,800,000, making it the best-available allocation method in practice, thus also validating why it's an active research area right now.
Incorporating technological advances
Now we approach the final section on best practices and the approaches to keeping up with competitive market participants and changing market conditions. As we've discussed, algorithmic/quantitative trading is largely a technology business and advances made in technology over the years have a large impact on the algorithmic trading business. Advances in technology is what allowed modern electronic trading in the first place, starting from outcry pits to mostly-automated and technology-assisted trading. Advances leading to faster trading servers, specialized network switches capable of higher throughput and lower switching latencies, advances made in network card technology and kernel bypass mechanisms, and even FPGA technology are important examples of this. This has caused the electronic trading business to evolve into a high-frequency, round-the-clock trading business where it is mostly automated trading bots trading against other automated trading bots.
Not only have there been hardware enhancements, but even software development practices have evolved over time. Now, large teams of talented software engineers have figured out how to build scalable and extremely low latency trading systems and trading strategies. This has been assisted by a combination of the evolution of both low-level and high-level programming languages, such as C, C++, and Java, along with improvements in compilers that can produce highly-optimized code; both have significantly improved the scalability and speed of what trading systems and trading strategies can be deployed to live trading markets.
A lot of market participants also now have access to microwave networks that can transmit data between locations much faster than physical fiber connections can, leading to latency-arbitrage opportunities. Time and time again, participants who have maintained their technological edge and kept up with the technological advancements made by their competition have been the ones to survive. Large algorithmic/HFT trading firms with superior technologies have even cornered the market on some trades and made it impossible for others to compete with them.
To summarize the main point of this section, algorithmic trading firms must continuously evolve their use of technology for their trading business to stay competitive. If other market participants gain access to breakthrough technologies, market participants who do not adapt will get wiped out.
Summary
This chapter explored what happens when algorithmic trading system and algorithmic trading strategies are deployed to live markets after months, and often years, of development and research. Many common issues with live trading strategies, such as not behaving or performing according to expectations, were discussed and we provided common causes and possible solutions or approaches to remedy these. This should help to prepare anyone looking to build and deploy algorithmic trading strategies to live markets, and equip them with the knowledge to improve trading strategy components when things don't go as expected.
Once the initial trading strategies are deployed and running in live markets as per expectations, we discussed the evolving nature of the algorithmic trading business and global markets in general. We covered a lot of different factors that cause profitable strategies to slowly decay due to a variety of reasons, both internal to the trading strategy itself and external in the form of other market participants and external conditions. We explored the different factors at play and the enormous amount of work that needs to be done on a continual basis to stay consistently profitable.