k8s云原生环境搭建笔记——第二篇
目录
-
- 1、使用普通方式安装prometheus和grafana
-
- 1.1、安装kube-state-metrics容器
-
- 1.1.1、下载并修改yaml文件
- 1.1.2、导入kube-state-metrics镜像
- 1.1.3、执行yaml文件目录
- 1.2、安装node-exploer
-
- 1.2.1、创建名称空间prometheus
- 1.2.2、执行yaml
- 1.3、安装prometheus
-
- 1.3.1、创建集群角色、账户、绑定
- 1.3.2、创建prometheus
- 1.4、安装grafana
- 1.5、配置可视化大屏
-
- 1.5.1、登录grafana首页
- 1.5.2、配置prometheus作为数据源
- 1.5.3、配置可视化大屏
- 1.6、问题排查方案
- 1.7、参考文档
- 2、安装loki
-
- 2.1、创建名称空间logging
- 2.2、安装loki
- 2.3、安装loki-promtail
- 2.3、判断loki是否安装成功
- 2.5、在grafana中配置loki
- 2.6、在grafana中使用loki
- 3、安装postgresql
-
- 3.1、创建名称空间postgresql
- 3.2、执行yaml
- 3.3、使用Navicat连接postgresql
- 4、安装doris(TODO 最少搭建起来还是会报错,后续在解决吧)
-
- 4.1、创建名称空间doris-cluster
- 4.2、搭建doris-be-cluster服务
- 4.3、搭建doris-cn-cluster服务
- 4.4、搭建doris-follower-cluster服务
1、使用普通方式安装prometheus和grafana
1.1、安装kube-state-metrics容器
1.1.1、下载并修改yaml文件
直接下载最终结果:
考虑到文件查找步骤的描述较多,我本次直接给大家提供这些yaml文件的百度网盘链接,然后kube-state-metrics版本是2.5.0,部署的名称空间是kube-system
链接:https://pan.baidu.com/s/1vnUMmlDexRi_Dd6vq9u87A?pwd=7728
提取码: 7728
文件查找步骤(当百度网盘中文件不符合要求时在看):
首先yaml文件存储在gitlab中,地址是:https://github.com/kubernetes/kube-state-metrics/
但是gitlab经常无法访问,所以给大家找到一个gitee地址(同步gitlab代码),地址是:https://gitee.com/pigmanwlj/kube-state-metrics
然后确定镜像版本,比如我本次使用版本信息是2.5,那就在上述gitee链接中找到版本为2.5的分支,地址是:https://gitee.com/pigmanwlj/kube-state-metrics/tree/release-2.5/
然后yaml文件放在kube-state-metrics/examples/standard路径下面,地址是:https://gitee.com/pigmanwlj/kube-state-metrics/tree/release-2.5/examples/standard
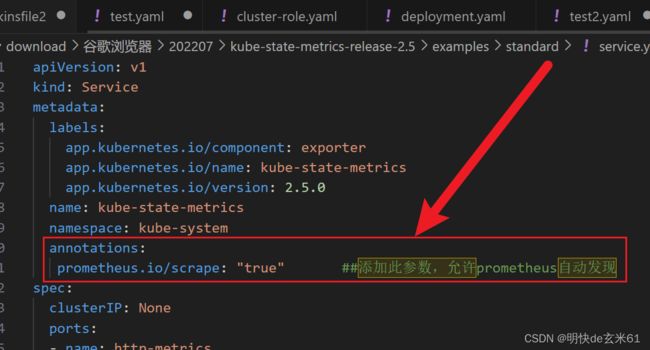
然后需要打开service.yaml,在名称空间后面添加如下内容:
  annotations:
   prometheus.io/scrape: "true"       ##添加此参数,允许prometheus自动发现
添加结果如下:
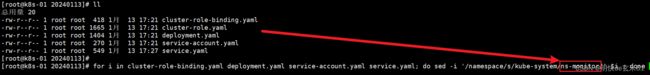
默认使用名称空间kube-system,如果想要修改名称空间,可以把standard目录下的所有yaml文件传到linux上,然后使用以下指定实现名称空间的更换
for i in cluster-role-binding.yaml deployment.yaml service-account.yaml service.yaml; do sed -i '/namespace/s/kube-system/新名称空间/' $i ; done
例如把名称空间换成ns-monitor,操作如下:
1.1.2、导入kube-state-metrics镜像
上面已经下载了yaml文件目录,里面包含deployment.yaml,看下里面image后面的镜像
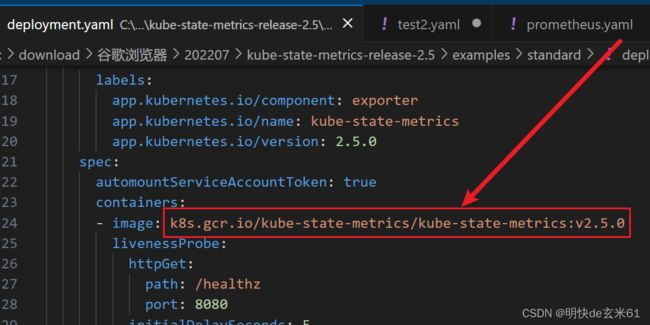
比如2.5.0版本的镜像是k8s.gcr.io/kube-state-metrics/kube-state-metrics:v2.5.0,但是由于网络原因,所以无法通过docker pull命令拉取到本地,这场我直接把2.5.0版本的镜像提供给你,百度网盘下载链接在下面
下载之后通过docker load -i kube-state-metrics_v2.5.0.tar导入即可
链接:https://pan.baidu.com/s/1RNO-z70sORi8mPHdMpB_Eg?pwd=msv1
提取码:msv1
1.1.3、执行yaml文件目录
我们把yaml文件目录上传到k8s主节点所在虚拟机上
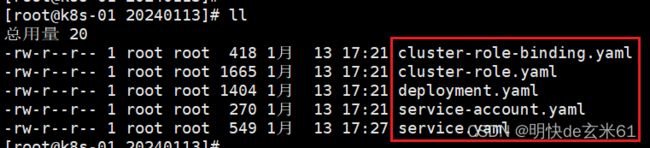
然后执行如下指令,该指令将会执行目录下的所有yaml文件
kubectl apply -f ./
1.2、安装node-exploer
1.2.1、创建名称空间prometheus
直接在kuboard平台操作
1.2.2、执行yaml
apiVersion: apps/v1
kind: DaemonSet
metadata:
  annotations:
    deprecated.daemonset.template.generation: '2'
  labels:
    app: node-exporter
  name: node-exporter
  namespace: prometheus
spec:
  selector:
    matchLabels:
      app: node-exporter
  template:
    metadata:
      labels:
        app: node-exporter
      name: node-exporter
    spec:
      containers:
        - image: 'prom/node-exporter:latest'
          imagePullPolicy: IfNotPresent
          name: node-exporter
          ports:
            - containerPort: 9100
              hostPort: 9100
              protocol: TCP

---

apiVersion: v1
kind: Service
metadata:
  annotations:
    prometheus.io/scrape: 'true' ##添加此参数,允许prometheus自动发现
  labels:
    k8s-app: node-exporter
  name: node-exporter
  namespace: prometheus
spec:
  ports:
    - name: http
      nodePort: 31672
      port: 9100
      protocol: TCP
      targetPort: 9100
  selector:
    app: node-exporter
  type: NodePort
注意: 如果无法下载镜像,或者后续执行有问题,都可以使用docer load -i 镜像tar包导入以下镜像
链接:https://pan.baidu.com/s/1uA4XHKfGsWjOBz6fONPS3g?pwd=2axl
提取码:2axl
1.3、安装prometheus
1.3.1、创建集群角色、账户、绑定
apiVersion: rbac.authorization.k8s.io/v1
kind: ClusterRole
metadata:
  annotations:
    rbac.authorization.kubernetes.io/autoupdate: 'true'
  name: prometheus
rules:
  - apiGroups:
      - ''
    resources:
      - nodes
      - nodes/proxy
      - services
      - endpoints
      - pods
    verbs:
      - get
      - list
      - watch
  - apiGroups:
      - networking.k8s.io
    resources:
      - ingresses
    verbs:
      - get
      - list
      - watch

---

apiVersion: v1
kind: ServiceAccount
metadata:
  name: prometheus
  namespace: prometheus

---

apiVersion: rbac.authorization.k8s.io/v1
kind: ClusterRoleBinding
metadata:
  name: prometheus
roleRef:
  apiGroup: rbac.authorization.k8s.io
  kind: ClusterRole
  name: prometheus
subjects:
- kind: ServiceAccount
  name: prometheus
  namespace: prometheus
1.3.2、创建prometheus
---
apiVersion: v1
data:
  prometheus.yml: |-
    global:
      scrape_interval:     15s
      evaluation_interval: 15s
    scrape_configs:
    - job_name: 'kubernetes-nodes'
      kubernetes_sd_configs:
      - role: node
      scheme: https
      tls_config:
        ca_file: /var/run/secrets/kubernetes.io/serviceaccount/ca.crt
      bearer_token_file: /var/run/secrets/kubernetes.io/serviceaccount/token
      relabel_configs:
      - action: labelmap
        regex: __meta_kubernetes_node_label_(.+)
      - target_label: __address__
        replacement: kubernetes.default.svc:443
      - source_labels: [__meta_kubernetes_node_name]
        regex: (.+)
        target_label: __metrics_path__
        replacement: /api/v1/nodes/${1}/proxy/metrics
    - job_name: 'kubernetes-cadvisor'
      kubernetes_sd_configs:
      - role: node
      scheme: https
      tls_config:
        ca_file: /var/run/secrets/kubernetes.io/serviceaccount/ca.crt
      bearer_token_file: /var/run/secrets/kubernetes.io/serviceaccount/token
      relabel_configs:
      - action: labelmap
        regex: __meta_kubernetes_node_label_(.+)
      - target_label: __address__
        replacement: kubernetes.default.svc:443
      - source_labels: [__meta_kubernetes_node_name]
        regex: (.+)
        target_label: __metrics_path__
        replacement: /api/v1/nodes/${1}/proxy/metrics/cadvisor
      metric_relabel_configs:
      - source_labels: [instance]
        separator: ;
        regex: (.+)
        target_label: node
        replacement: $1
        action: replace
      - source_labels: [pod_name]
        separator: ;
        regex: (.+)
        target_label: pod
        replacement: $1
        action: replace
      - source_labels: [container_name]
        separator: ;
        regex: (.+)
        target_label: container
        replacement: $1
        action: replace
    - job_name: 'kubernetes-service-endpoints'
      kubernetes_sd_configs:
      - role: endpoints
      relabel_configs:
      - source_labels: [__meta_kubernetes_service_annotation_prometheus_io_scrape]
        action: keep
        regex: true
      - source_labels: [__meta_kubernetes_service_annotation_prometheus_io_scheme]
        action: replace
        target_label: __scheme__
        regex: (https?)
      - source_labels: [__meta_kubernetes_service_annotation_prometheus_io_path]
        action: replace
        target_label: __metrics_path__
        regex: (.+)
      - source_labels: [__address__, __meta_kubernetes_service_annotation_prometheus_io_port]
        action: replace
        target_label: __address__
        regex: ([^:]+)(?::\d+)?;(\d+)
        replacement: $1:$2
      - action: labelmap
        regex: __meta_kubernetes_service_label_(.+)
      - source_labels: [__meta_kubernetes_namespace]
        action: replace
        target_label: kubernetes_namespace
      - source_labels: [__meta_kubernetes_service_name]
        action: replace
        target_label: kubernetes_name
      - source_labels: [__meta_kubernetes_pod_container_port_number]
        action: replace
        target_label: container_port
    - job_name: kube-state-metrics
      kubernetes_sd_configs:
      - role: endpoints
      relabel_configs:
      - source_labels: [__meta_kubernetes_service_label_app_kubernetes_io_name]
        regex: kube-state-metrics
        replacement: $1
        action: keep
      - action: labelmap
        regex: __meta_kubernetes_service_label_(.+)
      - source_labels: [__meta_kubernetes_namespace]
        action: replace
        target_label: k8s_namespace
      - source_labels: [__meta_kubernetes_service_name]
        action: replace
        target_label: k8s_sname
    - job_name: 'prometheus'
      static_configs:
        - targets: ['prometheus.prometheus:9090']
kind: ConfigMap
metadata:
  name: prometheus-config
  namespace: prometheus


---
apiVersion: apps/v1
kind: Deployment
metadata:
  labels:
    name: prometheus-deployment
  name: prometheus
  namespace: prometheus
spec:
  selector:
    matchLabels:
      app: prometheus
  template:
    metadata:
      labels:
        app: prometheus
    spec:
      containers:
        - args:
            - '--config.file=/etc/prometheus/prometheus.yml'
            - '--storage.tsdb.path=/prometheus'
            - '--storage.tsdb.retention=24h'
          command:
            - /bin/prometheus
          image: 'prom/prometheus:latest'
          imagePullPolicy: IfNotPresent
          name: prometheus
          ports:
            - containerPort: 9090
              protocol: TCP
          volumeMounts:
            - mountPath: /prometheus
              name: data
            - mountPath: /etc/prometheus
              name: config-volume
      serviceAccount: prometheus # 使用上面创建的用户,不能使用default用户,避免出现权限不足的问题
      serviceAccountName: prometheus # 使用上面创建的用户,不能使用default用户,避免出现权限不足的问题
      volumes:
        - emptyDir: {}
          name: data
        - configMap:
            name: prometheus-config
          name: config-volume

---

apiVersion: v1
kind: Service
metadata:
  labels:
    app: prometheus
  name: prometheus
  namespace: prometheus
spec:
  ports:
    - nodePort: 30003
      port: 9090
      protocol: TCP
      targetPort: 9090
  selector:
    app: prometheus
  type: NodePort
1.4、安装grafana
---
apiVersion: v1
data:
default.ini: >
##################### Grafana Configuration Defaults #####################
#
# Do not modify this file in grafana installs
#
# possible values : production, development
app_mode = production
# instance name, defaults to HOSTNAME environment variable value or hostname
if HOSTNAME var is empty
instance_name = ${HOSTNAME}
#################################### Paths ###############################
[paths]
# Path to where grafana can store temp files, sessions, and the sqlite3 db
(if that is used)
data = data
# Temporary files in `data` directory older than given duration will be
removed
temp_data_lifetime = 24h
# Directory where grafana can store logs
logs = data/log
# Directory where grafana will automatically scan and look for plugins
plugins = data/plugins
# folder that contains provisioning config files that grafana will apply on
startup and while running.
provisioning = conf/provisioning
#################################### Server ##############################
[server]
# Protocol (http, https, h2, socket)
protocol = http
# The ip address to bind to, empty will bind to all interfaces
http_addr =
# The http port to use
http_port = 3000
# The public facing domain name used to access grafana from a browser
domain = localhost
# Redirect to correct domain if host header does not match domain
# Prevents DNS rebinding attacks
enforce_domain = false
# The full public facing url
root_url = %(protocol)s://%(domain)s:%(http_port)s/
# Serve Grafana from subpath specified in `root_url` setting. By default it
is set to `false` for compatibility reasons.
serve_from_sub_path = false
# Log web requests
router_logging = false
# the path relative working path
static_root_path = public
# enable gzip
enable_gzip = false
# https certs & key file
cert_file =
cert_key =
# Unix socket path
socket = /tmp/grafana.sock
# CDN Url
cdn_url =
# Sets the maximum time in minutes before timing out read of an incoming
request and closing idle connections.
# `0` means there is no timeout for reading the request.
read_timeout = 0
#################################### Database ############################
[database]
# You can configure the database connection by specifying type, host, name,
user and password
# as separate properties or as on string using the url property.
# Either "mysql", "postgres" or "sqlite3", it's your choice
type = sqlite3
host = 127.0.0.1:3306
name = grafana
user = root
# If the password contains # or ; you have to wrap it with triple quotes. Ex
"""#password;"""
password =
# Use either URL or the previous fields to configure the database
# Example: mysql://user:secret@host:port/database
url =
# Max idle conn setting default is 2
max_idle_conn = 2
# Max conn setting default is 0 (mean not set)
max_open_conn =
# Connection Max Lifetime default is 14400 (means 14400 seconds or 4 hours)
conn_max_lifetime = 14400
# Set to true to log the sql calls and execution times.
log_queries =
# For "postgres", use either "disable", "require" or "verify-full"
# For "mysql", use either "true", "false", or "skip-verify".
ssl_mode = disable
# Database drivers may support different transaction isolation levels.
# Currently, only "mysql" driver supports isolation levels.
# If the value is empty - driver's default isolation level is applied.
# For "mysql" use "READ-UNCOMMITTED", "READ-COMMITTED", "REPEATABLE-READ" or
"SERIALIZABLE".
isolation_level =
ca_cert_path =
client_key_path =
client_cert_path =
server_cert_name =
# For "sqlite3" only, path relative to data_path setting
path = grafana.db
# For "sqlite3" only. cache mode setting used for connecting to the database
cache_mode = private
# For "mysql" only if lockingMigration feature toggle is set. How many
seconds to wait before failing to lock the database for the migrations,
default is 0.
locking_attempt_timeout_sec = 0
#################################### Cache server
#############################
[remote_cache]
# Either "redis", "memcached" or "database" default is "database"
type = database
# cache connectionstring options
# database: will use Grafana primary database.
# redis: config like redis server e.g.
`addr=127.0.0.1:6379,pool_size=100,db=0,ssl=false`. Only addr is required.
ssl may be 'true', 'false', or 'insecure'.
# memcache: 127.0.0.1:11211
connstr =
#################################### Data proxy ###########################
[dataproxy]
# This enables data proxy logging, default is false
logging = false
# How long the data proxy waits to read the headers of the response before
timing out, default is 30 seconds.
# This setting also applies to core backend HTTP data sources where query
requests use an HTTP client with timeout set.
timeout = 30
# How long the data proxy waits to establish a TCP connection before timing
out, default is 10 seconds.
dialTimeout = 10
# How many seconds the data proxy waits before sending a keepalive request.
keep_alive_seconds = 30
# How many seconds the data proxy waits for a successful TLS Handshake
before timing out.
tls_handshake_timeout_seconds = 10
# How many seconds the data proxy will wait for a server's first response
headers after
# fully writing the request headers if the request has an "Expect:
100-continue"
# header. A value of 0 will result in the body being sent immediately,
without
# waiting for the server to approve.
expect_continue_timeout_seconds = 1
# Optionally limits the total number of connections per host, including
connections in the dialing,
# active, and idle states. On limit violation, dials will block.
# A value of zero (0) means no limit.
max_conns_per_host = 0
# The maximum number of idle connections that Grafana will keep alive.
max_idle_connections = 100
# How many seconds the data proxy keeps an idle connection open before
timing out.
idle_conn_timeout_seconds = 90
# If enabled and user is not anonymous, data proxy will add X-Grafana-User
header with username into the request.
send_user_header = false
# Limit the amount of bytes that will be read/accepted from responses of
outgoing HTTP requests.
response_limit = 0
# Limits the number of rows that Grafana will process from SQL data sources.
row_limit = 1000000
#################################### Analytics ###########################
[analytics]
# Server reporting, sends usage counters to stats.grafana.org every 24
hours.
# No ip addresses are being tracked, only simple counters to track
# running instances, dashboard and error counts. It is very helpful to us.
# Change this option to false to disable reporting.
reporting_enabled = true
# The name of the distributor of the Grafana instance. Ex hosted-grafana,
grafana-labs
reporting_distributor = grafana-labs
# Set to false to disable all checks to https://grafana.com
# for new versions of grafana. The check is used
# in some UI views to notify that a grafana update exists.
# This option does not cause any auto updates, nor send any information
# only a GET request to
https://raw.githubusercontent.com/grafana/grafana/main/latest.json to get
the latest version.
check_for_updates = true
# Set to false to disable all checks to https://grafana.com
# for new versions of plugins. The check is used
# in some UI views to notify that a plugin update exists.
# This option does not cause any auto updates, nor send any information
# only a GET request to https://grafana.com to get the latest versions.
check_for_plugin_updates = true
# Google Analytics universal tracking code, only enabled if you specify an
id here
google_analytics_ua_id =
# Google Tag Manager ID, only enabled if you specify an id here
google_tag_manager_id =
# Rudderstack write key, enabled only if rudderstack_data_plane_url is also
set
rudderstack_write_key =
# Rudderstack data plane url, enabled only if rudderstack_write_key is also
set
rudderstack_data_plane_url =
# Rudderstack SDK url, optional, only valid if rudderstack_write_key and
rudderstack_data_plane_url is also set
rudderstack_sdk_url =
# Rudderstack Config url, optional, used by Rudderstack SDK to fetch source
config
rudderstack_config_url =
# Application Insights connection string. Specify an URL string to enable
this feature.
application_insights_connection_string =
# Optional. Specifies an Application Insights endpoint URL where the
endpoint string is wrapped in backticks ``.
application_insights_endpoint_url =
#################################### Security ############################
[security]
# disable creation of admin user on first start of grafana
disable_initial_admin_creation = false
# default admin user, created on startup
admin_user = admin
# default admin password, can be changed before first start of grafana, or
in profile settings
admin_password = admin
# used for signing
secret_key = SW2YcwTIb9zpOOhoPsMm
# current key provider used for envelope encryption, default to static value
specified by secret_key
encryption_provider = secretKey.v1
# list of configured key providers, space separated (Enterprise only): e.g.,
awskms.v1 azurekv.v1
available_encryption_providers =
# disable gravatar profile images
disable_gravatar = false
# data source proxy whitelist (ip_or_domain:port separated by spaces)
data_source_proxy_whitelist =
# disable protection against brute force login attempts
disable_brute_force_login_protection = false
# set to true if you host Grafana behind HTTPS. default is false.
cookie_secure = false
# set cookie SameSite attribute. defaults to `lax`. can be set to "lax",
"strict", "none" and "disabled"
cookie_samesite = lax
# set to true if you want to allow browsers to render Grafana in a ,