编程代码设计GUI界面
说在前面
GUI界面有元件拖动和编程代码两种设计方式,元件拖动比较直观,编程代码更加细致。本来搞了一个包含各种元件的项目,最后发现代码比较长,一下子扔出来对初学者非常不友好,所以我们分开一段一段来添加,以元件作为单位,由易到难。
普通按钮
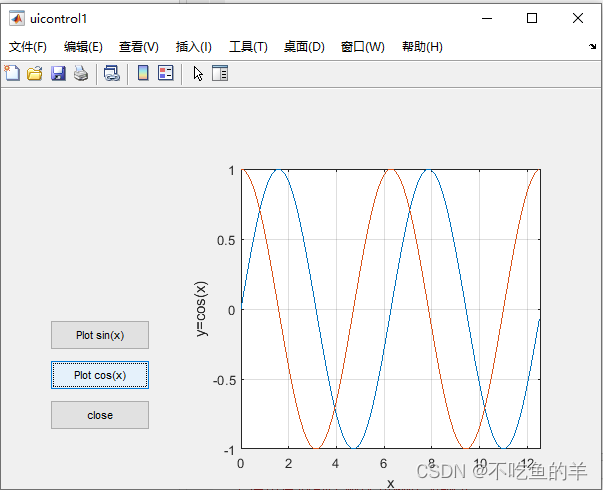
我们添加三个普通按钮,实现对应的功能:绘制sin、绘制cos和关闭。
hf=figure('position',[200 200 600 400],'Name','uicontrol1','NumberTitle','off');%窗口名字uicontrol1,隐藏窗口序号
ha=axes('position',[0.4 0.1 0.5 0.7],'Box','on');%开一个区域
hbsin=uicontrol(hf,...%在窗口里面添加普通按钮
    'Style','pushbutton',...%sin按钮
    'Position',[50 140 100 30],...
    'String','Plot sin(x)',...
    'CallBack',...
    ['hold off;'...
    'subplot(ha);'...%在区域里面作图
    'x=0:0.1:4*pi;'...
    'plot(x,sin(x));'...
    'axis([0 4*pi -1 1]);'...
    'grid on;'...
    'xlabel("x");'...
    'ylabel("y=sin(x)");'...
    ]);
hbcos=uicontrol(hf,...
    'Style','pushbutton',...%cos按钮
    'Position',[50 100 100 30],...
    'String','Plot cos(x)',...
    'CallBack',...
    ['hold on;'...
    'subplot(ha);'...
    'x=0:0.1:4*pi;'...
    'plot(x,cos(x));'...
    'axis([0 4*pi -1 1]);'...
    'grid on;'...
    'xlabel("x");'...
    'ylabel("y=cos(x)");'...
    ]);
hbclose=uicontrol(hf,...%close按钮
    'Style','pushbutton',...
    'Position',[50 60 100 30],...
    'String','close',...
    'CallBack','close(hf)');
实验效果
单选按钮
我们增加两个单选按钮,可以控制box的开关,但只能选择其中一个。
hrboxoff=uicontrol(gcf,'Style','radio',...%选中关闭密封坐标轴单选按钮
                'Position',[50 200 100 20],...%位置
                'String','set box off',...
                'Value',0,...
                'CallBack',[...
                'set(hrboxon,"Value",0);'...%显示选中效果
                'set(hrboxoff,"Value",1);'...
                'set(gca,"Box","off");']);
hrboxon=uicontrol(gcf,'Style','radio',...
                'Position',[50 230 100 20],...
                'String','set box on',...
                'Value',1,...
                'CallBack',[...
                'set(hrboxon,"Value",1);'...
                'set(hrboxoff,"Value",0);'...
                'set(gca,"Box","on");']);
实验效果
框架
在放入其他元件之前,框架应该先定义,不然会被覆盖。把下面这句代码放在单选按钮前面。
hfr=uicontrol(gcf,'style', 'frame','Position',[48 198 104 58]);%添加框架实验效果
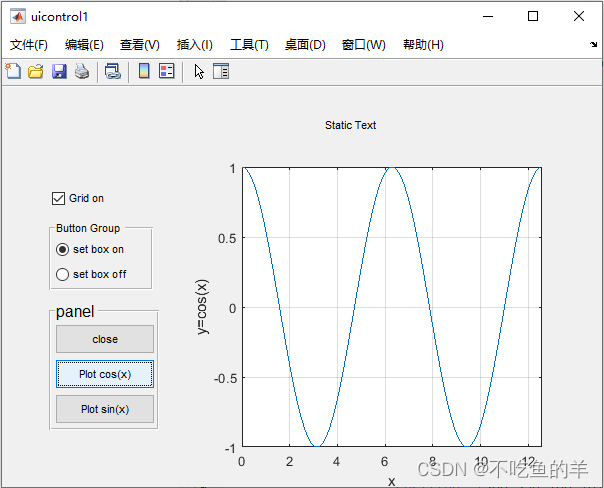
面板和按钮组
也是跟框架差不多,加多点层次感,这样划分功能模块容易很多。
为了演示面板和按钮组,我们可以先把框架的代码注释掉,再添加面板和按钮组。
面板
hp=uipanel('units','pixels',... %面板大小单位为像素
           'position',[48 58 110 130],...
            'Title','panel',...
            'FontSize',12);%面板
按钮组
hbg=uibuttongroup('units','pixels',...
                    'position',[48 198 104 70],...
                    'Title','Button Group');%按钮组
这个时候就要把普通按钮放在面板里面,单选按钮放在按钮组里面。从哪里继承,相对位置也要改下。
hbsin=uicontrol(hp,...%在面板里面添加元件
    'Style','pushbutton',...%sin 按钮
    'Position',[5 5 100 30],...
    'String','Plot sin(x)',...
    'CallBack',...
    ['hold off;'...
    'subplot(ha);'...%在区域里面作图
    'x=0:0.1:4*pi;'...
    'plot(x,sin(x));'...
    'axis([0 4*pi -1 1]);'...
    'grid on;'...
    'xlabel("x");'...
    'ylabel("y=sin(x)");'...
    ]);
hbcos=uicontrol(hp,...
    'Style','pushbutton',...%cos 按钮
    'Position',[5 40 100 30],...
    'String','Plot cos(x)',...
    'CallBack',...
    ['hold on;'...
    'subplot(ha);'...
    'x=0:0.1:4*pi;'...
    'plot(x,cos(x));'...
    'axis([0 4*pi -1 1]);'...
    'grid on;'...
    'xlabel("x");'...
    'ylabel("y=cos(x)");'...
    ]);
hbclose=uicontrol(hp,...%close按钮
    'Style','pushbutton',...
    'Position',[5 75 100 30],...
    'String','close',...
    'CallBack','close(hf)');
hrboxoff=uicontrol(hbg,'Style','radio',...%选中关闭密封坐标轴单选按钮
                'Position',[5 5 100 20],...%位置
                'String','set box off',...
                'Value',0,...
                'CallBack',[...
                'set(hrboxon,"Value",0);'...%显示选中效果
                'set(hrboxoff,"Value",1);'...
                'set(gca,"Box","off");']);
hrboxon=uicontrol(hbg,'Style','radio',...
                'Position',[5 30 100 20],...
                'String','set box on',...
                'Value',1,...
                'CallBack',[...
                'set(hrboxon,"Value",1);'...
                'set(hrboxoff,"Value",0);'...
                'set(gca,"Box","on");']);
实验效果
复选框
建立一个复选框控制绘制出来的函数图形的网格显示
hcGrid=uicontrol(hf,'Style','check',...%复选框
                'Position',[50 280 100 20],...
                'String','Grid on',...
                'Value',1,...
                'CallBack',[...
                'if get(hcGrid,"Value") == 1;'...
                'grid on;'...
                'else;'...
                'grid off;'...
                'end;'...
                ]);
在绘制的时候也可以判断复选框的状态
hbsin=uicontrol(hp,...%在面板里面添加元件
    'Style','pushbutton',...%sin 按钮
    'Position',[5 5 100 30],...
    'String','Plot sin(x)',...
    'CallBack',...
    ['hold off;'...
    'subplot(ha);'...%在区域里面作图
    'x=0:0.1:4*pi;'...
    'plot(x,sin(x));'...
    'axis([0 4*pi -1 1]);'...
    'xlabel("x");'...
    'ylabel("y=sin(x)");'...
    'if get(hcGrid,"Value") == 1;'...
    'grid on;'...
    'else;'...
    'grid off;'...
    'end;'...
    ]);
hbcos=uicontrol(hp,...
    'Style','pushbutton',...%cos 按钮
    'Position',[5 40 100 30],...
    'String','Plot cos(x)',...
    'CallBack',...
    ['subplot(ha);'...
    'x=0:0.1:4*pi;'...
    'plot(x,cos(x));'...
    'axis([0 4*pi -1 1]);'...
    'xlabel("x");'...
    'ylabel("y=cos(x)");'...
    'if get(hcGrid,"Value") == 1;'...
    'grid on;'...
    'else;'...
    'grid off;'...
    'end;'...
    ]);
实验效果
文本标签
这种就容易了,只是放个文字上去。
ht=uicontrol(hf,'Style','text',...%文本框
                'Position',[300 350 100 20],...
                'String','Static Text');
实验效果
可编辑文本框
新建个可编辑文本框,写入数值,在绘制图像的时候根据输入的数值来画出不一样的图片。
varX=['NumStr=get(heNum,"String");',...%调用,初始化和每一次修改数值都会调用一次
    'Num=str2num(NumStr);'];
heNum=uicontrol(hf,'Style','edit',...%可编辑文本框
                'Position',[50 320 100 20],...
                'String','4',...%初始值为4
                'CallBack',varX);
htpi=uicontrol(hf,'Style','text',...%文本框
                'Position',[150 320 20 20],...
                'String','pi');
普通按钮修改,根据读入的数据Num绘制Num*sin(x)和Num*cos(x)图像。
hbsin=uicontrol(hp,...%在面板里面添加元件
    'Style','pushbutton',...%sin 按钮
    'Position',[5 5 100 30],...
    'String','Plot Num*sin(x)',...
    'CallBack',...
    ['hold off;'...
    'subplot(ha);'...%在区域里面作图
    'x=0:0.1:4*pi;'...
    'plot(x,Num*sin(x));'...
    'axis([0 4*pi -1 1]);'...
    'xlabel("x");'...
    'ylabel("y=Num*sin(x)");'...
    'if get(hcGrid,"Value") == 1;'...
    'grid on;'...
    'else;'...
    'grid off;'...
    'end;'...
    ]);
hbcos=uicontrol(hp,...
    'Style','pushbutton',...%cos 按钮
    'Position',[5 40 100 30],...
    'String','Plot Num*cos(x)',...
    'CallBack',...
    ['subplot(ha);'...
    'x=0:0.1:4*pi;'...
    'plot(x,Num*cos(x));'...
    'axis([0 4*pi -1 1]);'...
    'xlabel("x");'...
    'ylabel("y=Num*cos(x)");'...
    'if get(hcGrid,"Value") == 1;'...
    'grid on;'...
    'else;'...
    'grid off;'...
    'end;'...
    ]);
实验效果
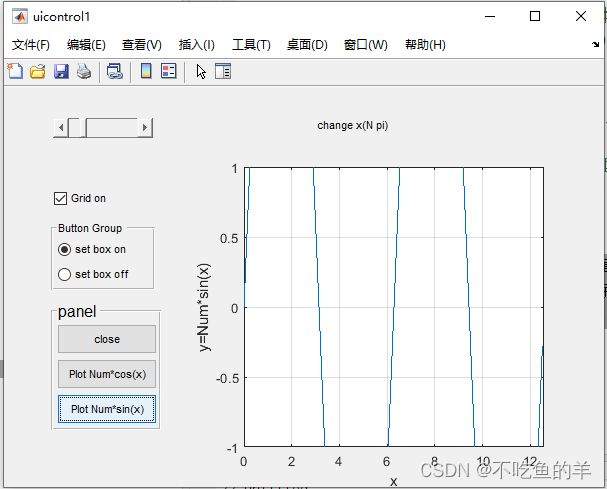
滑动条
这次就不用可编辑文本框来控制绘图了,改用滑动条,把上面可编辑文本框的代码注释掉,改成滑动条的。
varX=['Num=get(hs,"value");'];%调用,初始值和每一次滑动都会调用一次
hs=uicontrol(hf,'Style','slider',...%滑动条
                'Position',[50 350 100 20],...
                'value',4,...
                'Min',1,...
                'Max',20,...
                'CallBack',varX);
实验效果
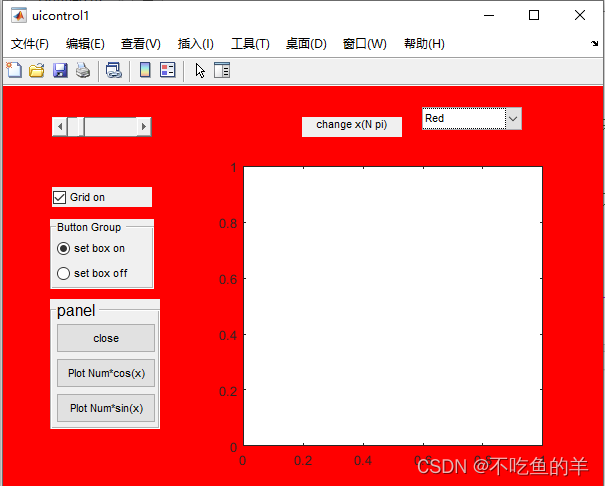
下拉菜单
建立一个下拉菜单,里面可以改变图形窗口的颜色
colorCallBack=['UD=get(hpcolor,"UserData");'...%获取UserData,一共8行3列
               'set(gcf,"color",UD(get(hpcolor,"value"),:))'];
           %get(hpcolor,"value")获取到下拉菜单的Value
           %UD(get(hpcolor,"value"),:)获取到UserData里面,Value的那一行
           %RGB值设置为图形窗口的颜色
hpcolor=uicontrol(gcf,'style', 'popupmenu',...%下拉菜单
            'Position',[420 360 100 20],...
            'String','Black|Red|Yellow|Green|Cyan|Blue|Magenta|White',...%设置选项
            'Value',1,...%初始值为1,也就是Black
            'UserData',[[0 0 0];...
                        [1 0 0];...
                        [1 1 0];...
                        [0 1 0];...
                        [0 1 1];...
                        [0 0 1];...
                        [1 0 1];...
                        [1 1 1]],...
                        'CallBack',colorCallBack);
实验效果
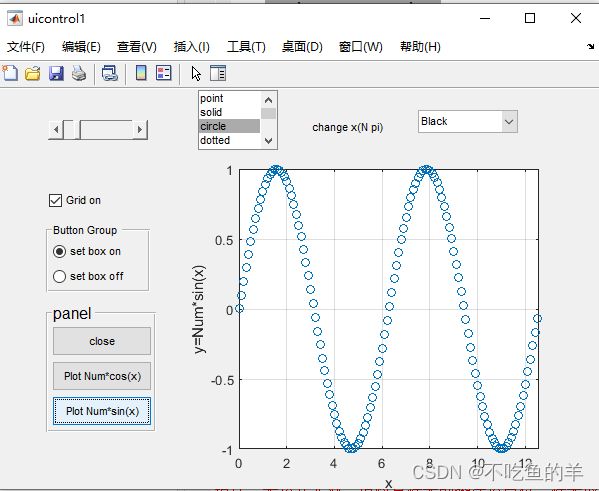
列表框
建立个列表框,可以选择线型。
LineSymbol=[".","-","o",":","x","-.","--","+","s","d","*"];%线型
hlist=uicontrol(gcf,'style', 'list',...%列表框
            'Position',[200 340 80 60],...
            'String','point|solid|circle|dotted|x-mark|dashdot|dashed|plus|square|diamond|star',...%设置选项
            'Max',2);
这时候也要更新下画图的普通按钮
hbsin=uicontrol(hp,...%在面板里面添加元件
    'Style','pushbutton',...%sin 按钮
    'Position',[5 5 100 30],...
    'String','Plot Num*sin(x)',...
    'CallBack',...
    ['hold off;'...
    'subplot(ha);'...%在区域里面作图
    'x=0:0.1:4*pi;'...
    'symbol=get(hlist,"Value");'...
    'plot(x,Num*sin(x),LineSymbol{symbol});'...
    'axis([0 4*pi -1 1]);'...
    'xlabel("x");'...
    'ylabel("y=Num*sin(x)");'...
    'if get(hcGrid,"Value") == 1;'...
    'grid on;'...
    'else;'...
    'grid off;'...
    'end;'...
    ]);
hbcos=uicontrol(hp,...
    'Style','pushbutton',...%cos 按钮
    'Position',[5 40 100 30],...
    'String','Plot Num*cos(x)',...
    'CallBack',...
    ['subplot(ha);'...
    'x=0:0.1:4*pi;'...
    'symbol=get(hlist,"Value");'...
    'plot(x,Num*cos(x),LineSymbol{symbol});'...
    'axis([0 4*pi -1 1]);'...
    'xlabel("x");'...
    'ylabel("y=Num*cos(x)");'...
    'if get(hcGrid,"Value") == 1;'...
    'grid on;'...
    'else;'...
    'grid off;'...
    'end;'...
    ]);
实验效果
这个控件有个bug,由于它不是多选的,但又允许用户多选,当用户多选的时候就会导致报错,所以一般建议不要用这个控件。
双位按钮
做个按钮,按下打开网格显示,再按下就关闭网格显示,并且按钮上面的字会跟着改变。
htg=uicontrol(gcf,'style', 'toggle',...%双位按钮
            'String','Grid on',...
            'Position',[60 310 80 20],...
            'CallBack',[...
            'grid;'...
            'if length(get(htg,"String"))==7 & get(htg,"String")=="Grid on"'...
            'set(htg,"String","Grid off");'...
            'else;'...
            'set(htg,"String","Grid on");'...
            'end;']);
实验效果
总结
控件的名字
| 控件名称 | style |
| 普通按钮 | pushbutton |
| 单选按钮 | radio |
| 框架 | frame |
| 面板 | 无 |
| 按钮组 | 无 |
| 复选框 | check |
| 文本标签 | text |
| 可编辑文本框 | edit |
| 滑动条 | slider |
| 下拉菜单 | popupmenu |
| 列表框 | list |
| 双位按钮 | toggle |
callback的使用
如果callback比较短,可以直接放在控件的建立里面。
hbsin=uicontrol(hf,...%在窗口里面添加普通按钮
    'Style','pushbutton',...%sin按钮
    'Position',[50 140 100 30],...
    'String','Plot sin(x)',...
    'CallBack',...
    ['subplot(ha);'...%在区域里面作图
    'x=0:0.1:4*pi;'...
    'plot(x,sin(x));']);
如果callback比较长,还是建议放在外面。如果callback是其他文件的函数,还得在前面加个@来表示这个是函数指针。
SinCallBack= ['subplot(ha);'...%在区域里面作图
    'x=0:0.1:4*pi;'...
    'plot(x,sin(x));']
hbsin=uicontrol(hf,...%在窗口里面添加普通按钮
    'Style','pushbutton',...%sin按钮
    'Position',[50 140 100 30],...
    'String','Plot sin(x)',...
    'CallBack',SinCallBack);
多行连续
如果是callback以外的属性,每一行属性用单引号括起来,矩阵用[]括起来,用“,...”表示还有下一行。
callback属性,就用“...”表示还有下一行。
流程控制语句
里面的流程控制语句不使用冒号了,全部都用分号结尾,而且每一句都要。
