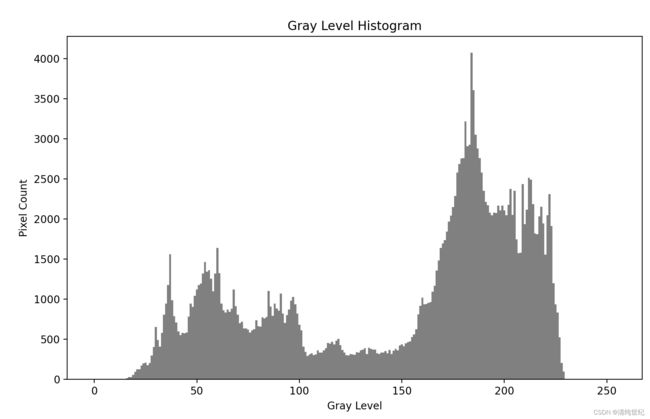
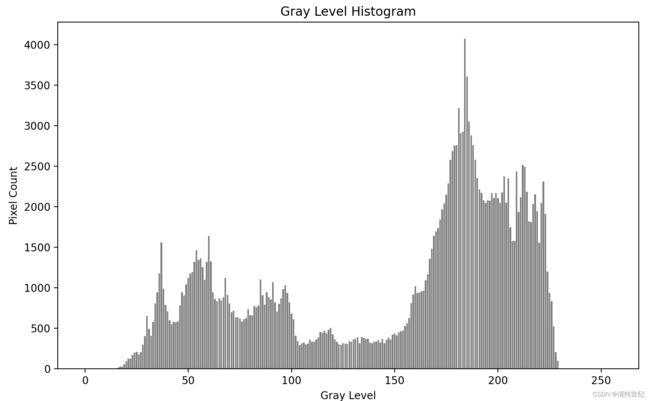
统计灰度图像的灰度值分布并绘制
1、numpy方法
函数:
numpy.histogram(a, bins=10, range=None, normed=None, weights=None, density=None)参数说明:
- a:输入数据数组;
- bins:指定统计的区间个数,可以是一个整数,也可以是一个数组,默认值为10;
- range:表示的是范围,范围仅为 (a.min(), a.max());表示统计范围的最小值和最大值,默认值None
- weights:表示权重。为数组的每个元素指定了权值,histogram()会对区间中数组所对应的权值进行求和
- density:为True时,返回每个区间的概率密度;为False,返回每个区间中元素的个数
返回:
- hist: 数组。直方图的值,有关可能语义的说明,请参见密度和权重。
- bin_edges: dtype 浮点数组。返回 bin 边
(length(hist)+1)。
代码示例:
import cv2
import numpy as np
import matplotlib.pyplot as plt

# 读取图像
image = cv2.imread(r"D:\Desktop\00aa\1.png", 0)

# 统计灰度值分布
hist, bins = np.histogram(image.flatten(), bins=range(256))

# 绘制直方图
plt.figure(figsize=(10, 6))
plt.bar(bins[:-1], hist, width=1, color='gray')
plt.xlabel('Gray Level')
plt.ylabel('Pixel Count')
plt.title('Gray Level Histogram')
plt.show()
2、OpenCv方法
我们也可以用OpenCv方法:
cv2.calcHist(images, channels, mask, histSize, ranges)参数:
- images:原图像。当传入函数时应该用中括号 [] 括起来,例如:[img]
- channels:如果输入图像是灰度图,它的值就是[0];如果是彩色图像的话,传入的参数可以是[0],[1],[2]它们分别对应着通道B,G,R。
- mask:掩模图像。要统计整幅图像的直方图就把它设为None。但是如果你想统计图像某一部分的直方图的话,你就需要制作一个掩模图像,并使用它。0为背景,1为需要统计区域。
- histSize:bins的数目。也应该用中括号括起来,例如:[256]。
- ranges:像素值范围。通常为[0,256]。
代码示例:
import cv2 as cv
import matplotlib.pyplot as plt

src = cv.imread(r"D:\Desktop\00aa\1.png", 0)  # 直接以灰度图方式读入
img = src.copy()

# 统计灰度图
greyScale_map = cv.calcHist([img], [0], None, [256], [0, 256]).squeeze()

# 绘制灰度图
plt.figure(figsize=(10, 6), dpi=100)
plt.bar(range(len(greyScale_map)), greyScale_map, color='gray')
plt.xlabel('Gray Level')
plt.ylabel('Pixel Count')
plt.title('Gray Level Histogram')
plt.show()
