如何使用python opencv比较直方图的三种方法
从一组图像中提取了颜色直方图,但是,将如何比较它们的相似性呢?下面将展示使用python opencv比较直方图的三种不同的方法。
方法一:使用OpenCV cv2.compareHist函数
opencv有一个内置的方法可以方便地比较直方图:cv2.compareHist(H1, H2, method)。该函数有三个参数:H1:要比较的第一个直方图;H2:要比较的第二个直方图;method:比较的方法。
method方法包括:
- 相关性比较 cv2.HISTCMP_CORREL:值越大,相似度越高
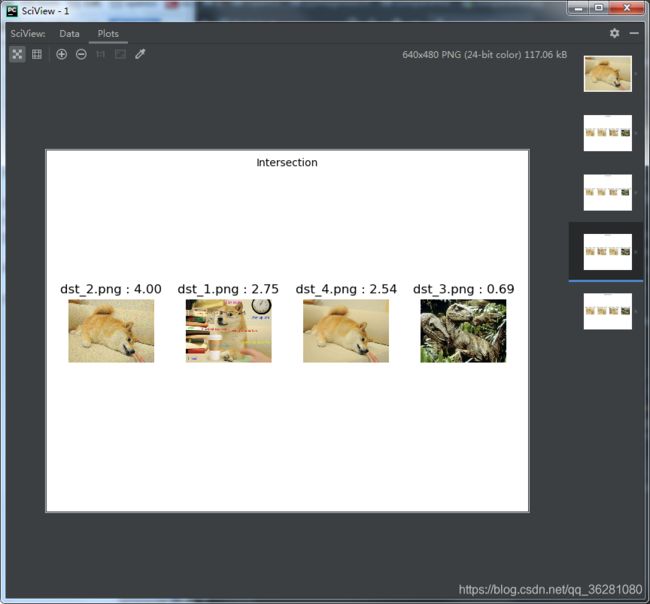
- 相交性比较 cv2.HISTCMP_INTERSECT:值越大,相似度越高
- 卡方比较 cv2.HISTCMP_CHISQR:值越小,相似度越高
- 巴氏距离比较 cv2.HISTCMP_BHATTACHARYYA:值越小,相似度越高
建立项目compareHist.py,代码如下。
#! /usr/bin/env python
# -*- coding: utf-8 -*-

from scipy.spatial import distance as dist
import matplotlib.pyplot as plt
import numpy as np
import cv2
import glob

def compareHistOneMethod():
	# 存储颜色直方图
	index = {}
	# 存储图像
	images = {}
	# 本地加载的图像
	fileNameStr = ['dst_4.png', 'dst_2.png', 'dst_1.png', 'dst_3.png']
	# 比较的图像
	compareFileName = fileNameStr[1]
	# 提取每个图像的颜色直方图
	for i, fileName in enumerate(fileNameStr):
		print('[INFO] : {}. {}'.format(i, fileName))
		# 读取图像
		image = cv2.imread(fileName)
		# 转换成RGB
		images[fileName] = cv2.cvtColor(image, cv2.COLOR_BGR2RGB)
		# 提取颜色直方图
		hist = cv2.calcHist([image], [0, 1, 2], None, [8, 8, 8], [0, 256, 0, 256, 0,256])
		# 归一均衡化
		hist = cv2.normalize(hist, hist).flatten()
		index[fileName] = hist
	# opencv自带的直方图比较方法
	OPENCV_METHODS = (
		# 相关性比较
		("Correlation", cv2.HISTCMP_CORREL),
		# 卡方比较
		("Chi-Squared", cv2.HISTCMP_CHISQR),
		# 相交性比较
		("Intersection", cv2.HISTCMP_INTERSECT),
		# 巴氏距离比较
		("Bhattacharyya", cv2.HISTCMP_BHATTACHARYYA))

	for (methodName, method) in OPENCV_METHODS:
		results = {}
		reverse = False
		# Correlation 和 Intersection 相似度越高,值越大
		if methodName in ("Correlation", "Intersection"):
			reverse = True
		# 将源直方图与目标直方图进行比较
		for (k, hist) in index.items():
			d = cv2.compareHist(index[compareFileName], hist, method)
			results[k] = d
		# 排序
		results = sorted([(v, k) for (k, v) in results.items()], reverse = reverse)

		plt.figure('Query')
		plt.imshow(images[compareFileName])
		plt.axis('off')
		fig = plt.figure('Results:{}'.format(methodName))
		fig.suptitle(methodName, fontsize=10)
		for i, (v, k) in enumerate(results):
			ax = fig.add_subplot(1, len(images), i+1)
			ax.set_title('{} : {:.2f}'.format(k, v))
			#print('[INFO] : {} {} : {:.2f}'.format(methodName, k, v))
			plt.imshow(images[k])
			plt.axis('off')
	plt.show()

def main():
	compareHistOneMethod()

if __name__ == "__main__":
	main()
方法二:使用SciPy距离函数
Scipy距离函数具体使用欧几里德距离函数(euclidean),曼哈段距离函数(cityblock),切比雪夫距离(chebyshev)。
建立项目compareHist.py,代码如下:
#! /usr/bin/env python
# -*- coding: utf-8 -*-

from scipy.spatial import distance as dist
import matplotlib.pyplot as plt
import numpy as np
import cv2
import glob

def compareHistTwoMethod():
	# 存储颜色直方图
	index = {}
	# 存储图像
	images = {}
	# 本地加载的图像
	fileNameStr = ['dst_4.png', 'dst_2.png', 'dst_1.png', 'dst_3.png']
	# 比较的图像
	compareFileName = fileNameStr[1]
	# 提取每个图像的颜色直方图
	for i, fileName in enumerate(fileNameStr):
		print('[INFO] : {}. {}'.format(i, fileName))
		# 读取图像
		image = cv2.imread(fileName)
		# 转换成RGB
		images[fileName] = cv2.cvtColor(image, cv2.COLOR_BGR2RGB)
		# 提取颜色直方图
		hist = cv2.calcHist([image], [0, 1, 2], None, [8, 8, 8], [0, 256, 0, 256, 0, 256])
		# 归一均衡化
		hist = cv2.normalize(hist, hist).flatten()
		index[fileName] = hist

	# SciPy距离函数
	SCIPY_METHODS = (
		# 欧几里德距离
		("Euclidean", dist.euclidean),
		# 曼哈段距离
		("Manhattan", dist.cityblock),
		# 切比雪夫距离
		("Chebysev", dist.chebyshev))

	for methodName, method in SCIPY_METHODS:
		results = {}
		# 将源直方图与目标直方图进行一一比较
		for (k, hist) in index.items():
			d = method(index[compareFileName], hist)
			results[k] = d
		# 排序
		results = sorted([(v, k) for (k, v) in results.items()])

		plt.figure('Query')
		plt.imshow(images[compareFileName])
		plt.axis('off')
		fig = plt.figure('Results:{}'.format(methodName))
		fig.suptitle(methodName, fontsize=10)
		for i, (v, k) in enumerate(results):
			ax = fig.add_subplot(1, len(images), i + 1)
			ax.set_title('{} : {:.2f}'.format(k, v))
			# print('[INFO] : {} {} : {:.2f}'.format(methodName, k, v))
			plt.imshow(images[k])
			plt.axis('off')
	plt.show()


def main():
	#compareHistOneMethod()
	compareHistTwoMethod()


if __name__ == "__main__":
	main()
方法3:自行计算相似度
自定义卡方距离(chi-Squared)函数:
def chi2_distance(histA, histB, eps=1e-10):
	# 自定义计算卡方距离
	d = 0.5 * np.sum([((a - b) ** 2) / (a + b + eps)
		for (a, b) in zip(histA, histB)])
	return d
建立项目compareHist.py,代码如下:
#! /usr/bin/env python
# -*- coding: utf-8 -*-

from scipy.spatial import distance as dist
import matplotlib.pyplot as plt
import numpy as np
import cv2
import glob

def chi2_distance(histA, histB, eps=1e-10):
	# 自定义计算卡方距离
	d = 0.5 * np.sum([((a - b) ** 2) / (a + b + eps)
		for (a, b) in zip(histA, histB)])
	return d

def compareHistThreeMethod():

	# 存储颜色直方图
	index = {}
	# 存储图像
	images = {}
	# 本地加载的图像
	fileNameStr = ['dst_4.png', 'dst_2.png', 'dst_1.png', 'dst_3.png']
	# 比较的图像
	compareFileName = fileNameStr[1]
	# 提取每个图像的颜色直方图
	for i, fileName in enumerate(fileNameStr):
		print('[INFO] : {}. {}'.format(i, fileName))
		# 读取图像
		image = cv2.imread(fileName)
		# 转换成RGB
		images[fileName] = cv2.cvtColor(image, cv2.COLOR_BGR2RGB)
		# 提取颜色直方图
		hist = cv2.calcHist([image], [0, 1, 2], None, [8, 8, 8], [0, 256, 0, 256, 0, 256])
		# 归一均衡化
		hist = cv2.normalize(hist, hist).flatten()
		index[fileName] = hist

	results = {}

	for (k, hist) in index.items():
		d = chi2_distance(index[compareFileName], hist)
		results[k] = d
	# 排序
	results = sorted([(v, k) for (k, v) in results.items()])

	plt.figure('Query')
	plt.imshow(images[compareFileName])
	plt.axis('off')
	fig = plt.figure('Results: Custom Chi-Squared')
	fig.suptitle('Custom Chi-Squared', fontsize=10)
	for i, (v, k) in enumerate(results):
		ax = fig.add_subplot(1, len(images), i + 1)
		ax.set_title('{} : {:.2f}'.format(k, v))
		# print('[INFO] : {} {} : {:.2f}'.format(methodName, k, v))
		plt.imshow(images[k])
		plt.axis('off')
	plt.show()

def main():
	#compareHistOneMethod()
	#compareHistTwoMethod()
	compareHistThreeMethod()

if __name__ == "__main__":
	main()
总结
在这篇文章中,使用了三种使用python opencv比较直方图的方法。
第一种方法是使用cv2.compareHist,opencv内置的函数。它的好处是运行的非常快,性能提升将非常高。
第二种方法基于SciPy包中包含的距离函数。
但以上两种方法都不是你想要比较的直方图的方法,可以自定义距离函数,比较直方图的相似度已达到自己想要的结果和功能。
下载
源代码和素材
参考资料
https://www.pyimagesearch.com/
