1,代码
\documentclass[]{article}
\usepackage{tikz}
\usepackage{pgfplots}
\begin{document}
\begin{tikzpicture}
\draw (0,0) -- (1,1);%hello
\end{tikzpicture}
\begin{tikzpicture}
\draw[step=1,color=gray!40] (-2,-2) grid (2,2);
\draw[->] (-3,0) -- (3,0);
\draw[->] (0,-3) -- (0,3);
\draw (0,0) circle (1);
\end{tikzpicture}
\begin{tikzpicture}
\draw[help lines] ( -5,-5 ) grid ( 5, 5);
\end{tikzpicture}
\begin{tikzpicture}
\draw[help lines] ( -5,-5 ) grid ( 5, 5);
\draw[red] (-3,0) -- (3,0);
\draw[red] (0,-3) -- (0,3);
\end{tikzpicture}
hello\\
\begin{tikzpicture}
\draw[->] (-3,3) -- (3,3);
\draw[->>] (-3,2) -- (3,2);
\draw[->|] (-3,1) -- (3,1);
\draw[-to] (-3,0) -- (3,0);
\draw[-latex] (-3,-1) -- (3,-1);
\draw[-stealth] (-3,-2) -- (3,-2);
\end{tikzpicture}
\begin{tikzpicture}
\draw[step=1,color=gray!40] (-2,-2) grid (2,2);
\draw[->] (-3,0) -- (3,0);
\draw[->] (0,-3) -- (0,3);
\draw (0,0) circle (1);
\end{tikzpicture}
\begin{tikzpicture}
\draw[step=1,color=gray!40] (-2,-2) grid (2,2);
\draw[->] (-3,0) -- (3,0);
\draw[->] (0,-3) -- (0,3);
\draw (0,0) ellipse (1 and 0.5);
\end{tikzpicture}
\begin{tikzpicture}
\draw[step=1,color=gray!40] (-2,-2) grid (2,2);
\draw[->] (-3,0) -- (3,0);
\draw[->] (0,-3) -- (0,3);
\draw[color=gray!40] (0,0) circle (1); %
\draw[color=red] (1,0) arc (0:45:1);
\draw[color=gray!40] (0,0) ellipse (1 and 0.5);
\draw[color=green] (1,0) arc (0:60:1 and 0.5);
\end{tikzpicture}
\begin{tikzpicture}[scale=2]
\draw[step=1,color=gray!40] (-2,-2) grid (2,2);
\draw[color=red] (-1,-1) rectangle (1,1);
\end{tikzpicture}
hello\\\\\\
\begin{tikzpicture}
\draw[step=1,color=gray!40] (-2,-2) grid (2,2);
\path (1,1) coordinate (p1);
\coordinate (p2) at ( 2, 0);
\draw[dotted, red] (p1) -- (p2) ;
\end{tikzpicture}
\begin{tikzpicture}[scale=2]
\draw[step=1,color=gray!40] (-2,-2) grid (2,2);
\draw[latex-latex, red] (0,-2) -- ++(-1,1) -- ++(-1,-1);
\draw[dashed, blue] (0,1) -- +(-1,1) -- +(-2,0);
\end{tikzpicture}
\\\\\\\\testtt\\\\\\\\
\begin{tikzpicture}
\node (node001) at (0,2) [draw] {test};
\end{tikzpicture}
\begin{tikzpicture}
\node (node001) at (0,2) [draw] {node001};
\node (node002) at (-2,0) [draw] {node002};
\node (node003) at (2,0) [draw] {node003};
\draw (node cs:name=node003,anchor=north) |- (0,1);
\draw (node002.north) |- (0,1) -| (node cs:name=node001,anchor=south);
\end{tikzpicture}
\\\\good testtt\\\\\\\\
\begin{tikzpicture}
\node (p1) at (30:1) {$p_1$} ;
\node (p2) at (75:1) {$p_2$} ;
\draw (-0.2,0) -- (1.2,0) node[right] (xline) {$q_1$};
\draw (2,-0.2) -- (2,1.2) node[above] (yline) {$q_2$};
\draw[->] (p1) -- (p1 |- xline);
\end{tikzpicture}
\begin{tikzpicture}
\node (p1) at (30:1) {$p_1$} ;
\node (p2) at (75:1) {$p_2$} ;
\draw (-0.2,0) -- (1.2,0) node[right] (xline) {$q_1$};
\draw (2,-0.2) -- (2,1.2) node[above] (yline) {$q_2$};
\draw[->] (p1) -- (p1 |- xline);
\end{tikzpicture}
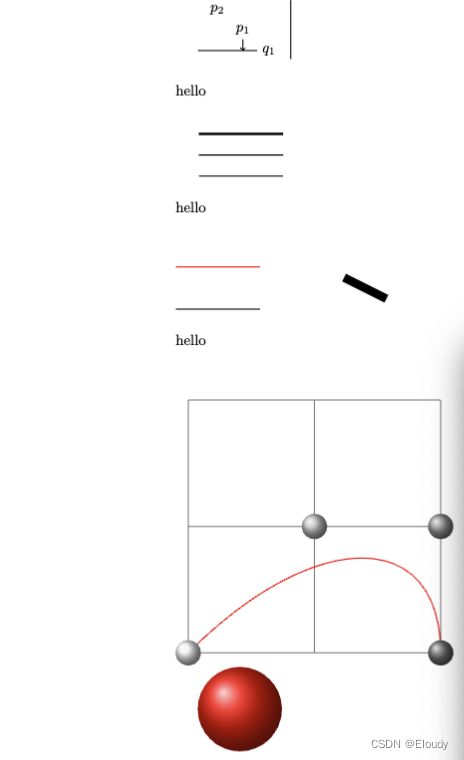
\\\\hello\\\\
\begin{tikzpicture}
\draw [ultra thick] (0,1) -- (2,1);
\draw [thick] (0,0.5) -- (2,0.5);
\draw [thin] (0,0) -- (2,0);
\end{tikzpicture}
\\\\hello\\\\\\\\
\begin{tikzpicture}
\draw [line width=0.4pt] (0,0) -- (2,0);
\draw[red] (0,1) -- (2,1);
\draw [line width=0.2cm] (4,.75) -- (5,.25);
\end{tikzpicture}
\\\\hello\\\\\\\\
\begin{tikzpicture}[scale=3]
\draw[help lines] (0,0) grid (2,2);
\draw[color=red] (0,0) .. controls (1,1) and (2,1) .. (2,0);
\shade[ball color=gray!10] (0,0) circle (0.1);
\shade[ball color=gray!40] (1,1) circle (0.1);
\shade[ball color=gray!70] (2,1) circle (0.1);
\shade[ball color=gray] (2,0) circle (0.1);
\end{tikzpicture}
\begin{tikzpicture}
\shade[ball color=red] (1,2) circle (1);
\end{tikzpicture}
\\\\hello\\\\\\\\
\begin{tikzpicture}[outline/.style={draw=#1,thick,fill=#1!50},
outline/.default=black]
\node [outline]
at (0,1) {default};
\node [outline=blue] at (0,0) {blue};
\end{tikzpicture}
\\\\hello\\\\\\\\
\usetikzlibrary{positioning}
\tikzset{place/.style={circle,draw=blue!50,fill=blue!20,
thick,inner sep=0pt,minimum size=6mm}}
\tikzset{transition/.style={rectangle,draw=black!50,
fill=black!20,thick,inner sep=0pt,minimum size=4mm}}
\tikzset{every label/.style=red}
\begin{tikzpicture}[bend angle=45]
\node[place] (waiting) {};
\node[place] (critical) [below=of waiting] {};
\node[place](semaphore) [below=of critical,label=above:$s\le3$] {};
\node[transition](leave critical) [right=of critical]{};
\node[transition] (enter critical)[left=of critical]{};
\draw [->] (enter critical) to (critical);
\draw [->] (waiting) to [bend right] (enter critical);
\draw [->] (enter critical) to [bend right] (semaphore);
\draw [->] (semaphore) to [bend right] (leave critical);
\draw [->] (critical) to (leave critical);
\draw [->] (leave critical) to [bend right] (waiting);
\end{tikzpicture}
\\\\hello\\\\\\\\
\begin{tikzpicture}
\draw[help lines] (0,0) grid (3,2);
\foreach \x in {0,1,...,4}
\draw[xshift=\x cm] (0,-1) -- (0,1);
\end{tikzpicture}
\\\\hello\\\\\\\\
\begin{tikzpicture}
\draw[help lines] (0,0) grid (3,2);
\draw (0,0) -- (1,1);
\draw[red] (0,0) -- ([xshift=1cm] 1,1);
\end{tikzpicture}
\\\\hello\\\\\\\\
\begin{tikzpicture}
\draw (0,0)[rotate=30] ellipse (2 and 1);
\end{tikzpicture}
\\\\hello\\\\\\\\
\begin{tikzpicture}
\begin{axis}
\addplot{x*2};
\end{axis}
\end{tikzpicture}
\\\\hello\\\\\\\\
\begin{tikzpicture}
\begin{axis}
\addplot coordinates
{(0,0)
(1,1)
(2,3)
(3,9)};
\end{axis}
\end{tikzpicture}
\\\\hello\\\\\\\\
\\\\hello\\\\\\\\
\\\\hello\\\\\\\\
\\\\hello\\\\\\\\
\\\\hello\\\\\\\\
\\\\hello\\\\\\\\
\\\\hello\\\\\\\\
\\\\hello\\\\\\\\
\\\\hello\\\\\\\\
\end{document}
2,效果示例