Matplotlib:绘图结构详解,Artist、Figure、Axes和Axis的联系与区别
目录
0. 引言
1. API层次
2. 绘图结构:Figure,Axes,Axis,Artist
- Figure:
- Axes:
- Axis:
- Artist:
- Figure中的artist元素
3. Coding Style
4. 参考文献
0. 引言
matplotlib是用Python语言实现的一个类似MATLAB的绘图工具,本文主要介绍matplotlib.pyplot的基本API层次、绘图结构及用法。1. 在matplotlib中最重要的基类Artist类及其派生类,主要分为容器类型(Figure,Axes,Axis等)和绘图元素类型(Line2D、 Rectangle、 Text、AxesImage 等)两类。2. 介绍matplotlib.pyplot的基本绘图结构,重点区分Figure,Axes,Axis三者的联系与区别,厘清plt.plot()和ax.plot()的异同。3. 介绍绘图Coding Sytle(面向对象风格object-oriented (OO) style和pyplot函数),掌握精调绘图细节,比如坐标轴范围、图例、标题等的绘图逻辑和方法。
1. API层次
matplotlib API包含有三层:
- backend_bases.FigureCanvas : 图表的绘制领域
- backend_bases.Renderer : 知道如何在FigureCanvas上如何绘图
- artist.Artist : 知道如何使用Renderer在FigureCanvas上绘图
FigureCanvas和Renderer需要处理底层的绘图操作,例如使用wxPython在界面上绘图,或者使用PostScript绘制PDF。Artist则处理所有的高层结构,例如处理图表、文字和曲线等的绘制和布局。通常我们只和Artist打交道,而不需要关心底层的绘制细节。
在matplotlib中最重要的基类Artist类及其派生类,主要分为容器类型和绘图元素类型两类,容器类型包括中Figure,Axes,Axis,这些类确定一个绘图区域,为元素类型提供显示位置;绘图元素类型包括Line2D、 Rectangle、 Text、AxesImage 等,这些是包含在容器类型提供的绘图区域中。
(参考:Python matplotlib高级绘图详解)
2. 绘图结构:Figure,Axes,Axis,Artist
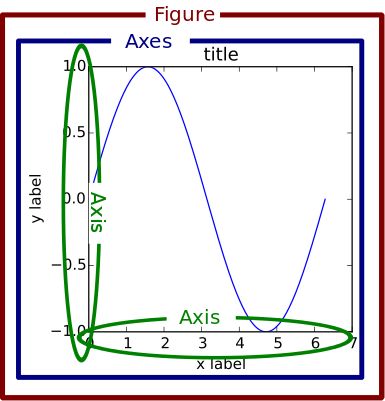
(图像来源:Usage)
- Figure:
红色的外框,可以把理解为一个画板,我们所有的内容都会画在这个“画板”上,Figure会包含所有的子Axes。
The whole figure (marked as the outer red box). The figure keeps track of all the child Axes, a smattering of ‘special’ artists (titles, figure legends, etc), and the canvas. (Don’t worry too much about the canvas, it is crucial as it is the object that actually does the drawing to get you your plot, but as the user it is more-or-less invisible to you). A figure can have any number of Axes, but to be useful should have at least one.
- Axes:
蓝色的内框,一套坐标轴组合,可以理解为一个坐标系(一个子图)。当只有一个axes的时候,plt.plot()和ax.plot()是在同一个图形上绘图;当有多个axes的时候,最好采用ax.plot()的方式绘图。
官方文档中:
Axes
This is what you think of as 'a plot', it is the region of the image with the data space. A given figure can contain many Axes, but a given
Axesobject can only be in oneFigure. The Axes contains two (or three in the case of 3D)Axisobjects (be aware of the difference between Axes and Axis) which take care of the data limits (the data limits can also be controlled via theaxes.Axes.set_xlim()andaxes.Axes.set_ylim()methods). EachAxeshas a title (set viaset_title()), an x-label (set viaset_xlabel()), and a y-label set viaset_ylabel()).(官方文档:Axes)
Axis 指 x、y 坐标轴等(如果有三维那就还有 z 轴),代表的是 “坐标轴”。而 Axes 在英文里是 Axis 的复数形式,也就是说 axes 代表的其实是 figure 当中的一套坐标轴。之所以说一套而不是两个坐标轴,是因为如果你画三维的图,axes 就代表 3 根坐标轴了。所以,在一个 figure 当中,每添加一次 subplot ,其实就是添加了一套坐标轴,也就是添加了一个 axes,放在二维坐标里就是你添加了两根坐标轴,分别是 x 轴和 y 轴。所以当你只画一个图的时候,plt.xxx 与 ax.xxx 其实都是作用在相同的图上的。
- Axis:
绿色的横纵坐标轴,上面包含刻度和标签(tick locations和labels)!
类似于下面这样,定义 4 个 subplot,自然就有 4 个Axes:
可以用如下代码创建:
plt.figure()
plt.gcf.subplots(2,2)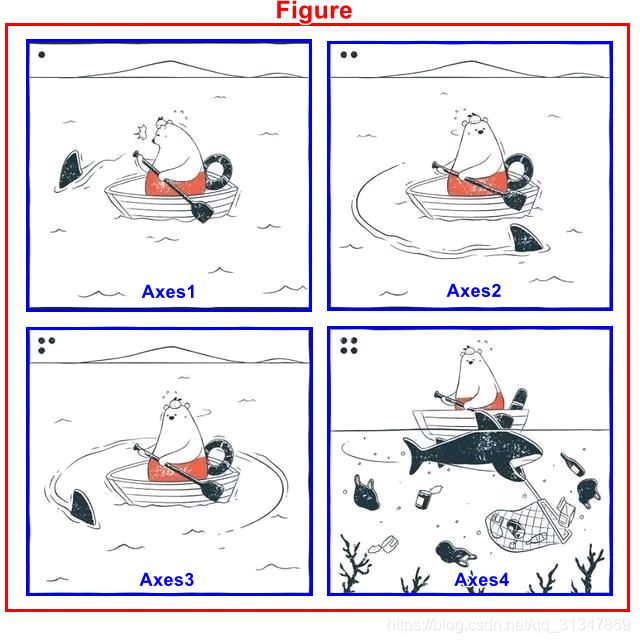
(图像来源:matplotlib绘图:figure和axes有什么区别?)
- Artist:
所有的绘图元素的基类,包含所有在figure中可以被看到的都是一个个artist。当一个figure被渲染的时候,所有的artists都被画在画布canvas上。大多数的artist都是和某个axes绑定的,这些artist不能同时属于多个axes。(因此当一个figure里有多个axes的时候最好是采用ax.plot()的方式绘图)
(图像来源:Artists)
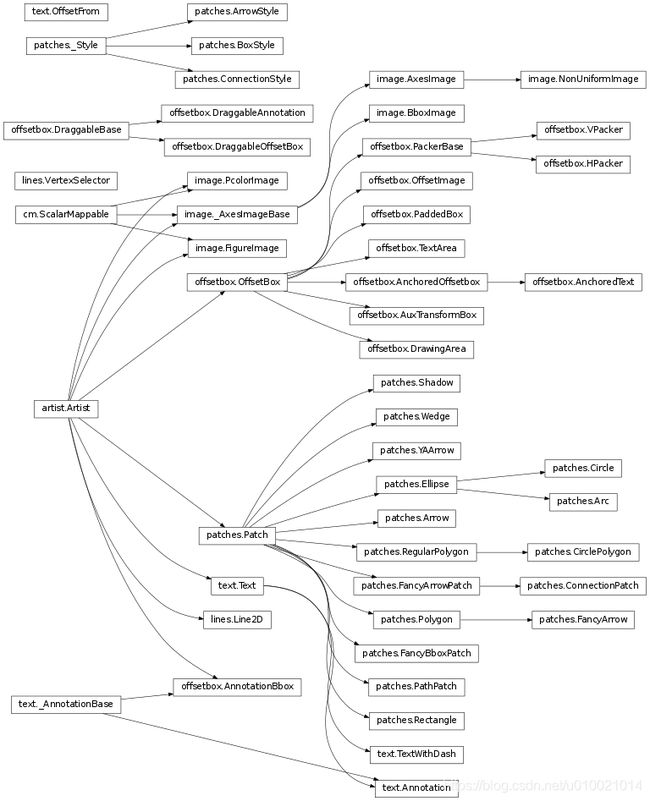
- Figure中的artist元素
Figure是最大的一个Aritist,它包括整幅图像的所有元素,一个Figure中的各个部分的artists元素如下图所示:
figure中所有的元素类型的artist的属性都可以用ax.set_XXX()和ax.get_XXX()来设置和获取。

(图像来源:Usage Guide)
3. Coding Style
具体使用matplotlib的时候有两种风格的绘图方式:面向对象风格和pyplot函数
As noted above, there are essentially two ways to use Matplotlib:
- Explicitly create figures and axes, and call methods on them (the "object-oriented (OO) style").
- Rely on pyplot to automatically create and manage the figures and axes, and use pyplot functions for plotting.
面向对象风格:
import matplotlib.pyplot as plt
import numpy as np


x = np.linspace(0, 2, 100)

# Note that even in the OO-style, we use `.pyplot.figure` to create the figure.
fig, ax = plt.subplots()  # Create a figure and an axes.
ax.plot(x, x, label='linear')  # Plot some data on the axes.
ax.plot(x, x**2, label='quadratic')  # Plot more data on the axes...
ax.plot(x, x**3, label='cubic')  # ... and some more.
ax.set_xlabel('x label')  # Add an x-label to the axes.
ax.set_ylabel('y label')  # Add a y-label to the axes.
ax.set_title("Simple Plot")  # Add a title to the axes.
ax.legend()  # Add a legend.

pyplot函数风格:
import matplotlib.pyplot as plt
import numpy as np


x = np.linspace(0, 2, 100)

plt.plot(x, x, label='linear')  # Plot some data on the (implicit) axes.
plt.plot(x, x**2, label='quadratic')  # etc.
plt.plot(x, x**3, label='cubic')
plt.xlabel('x label')
plt.ylabel('y label')
plt.title("Simple Plot")
plt.legend()
注意:两种风格都可以,但是在使用的时候最好不要混着用。
事实上,当调用plt.plot()、plt.scatter()、plt.bar(),其实本质上还是在 axes 上画图,可以将他们理解为:先在 figure(画板)上获取一个当前要操作的 axes(坐标系),如果没有 axes 就自动创建一个并将其设为当前的 axes,然后在当前这个 axes 上执行各种绘图功能。 plt. 就相当于 plt.gca().
注意区别:fig = plt.figure() 、plt.subplots() 和plt.subplots(2, 2)
fig = plt.figure()  # an empty figure with no Axes
fig, ax = plt.subplots()  # a figure with a single Axes
fig, axs = plt.subplots(2, 2)  # a figure with a 2x2 grid of Axes
(参考:Usage Guide)
4. 参考文献
1. matplotlib官方参考文档 https://matplotlib.org/tutorials/introductory/usage.html
2. Python matplotlib高级绘图详解 https://blog.csdn.net/matrix_laboratory/article/details/50698239
3. matplotlib绘图:figure和axes有什么区别? https://blog.csdn.net/qq_31347869/article/details/104794515