OpenCV4图像处理--二值图像联通组件扫描
联通组件扫描
- 图像联通组件标记概念
- 扫描联通组件的常见算法
- 思考
图像联通组件标记概念
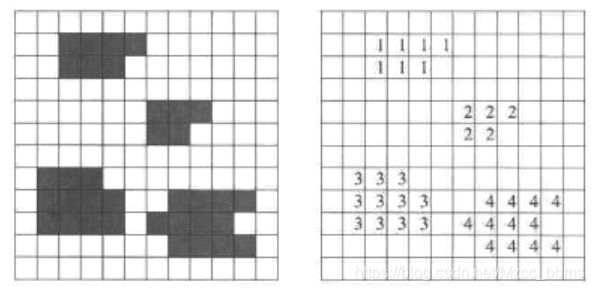
- 图像联通组件(CCL)
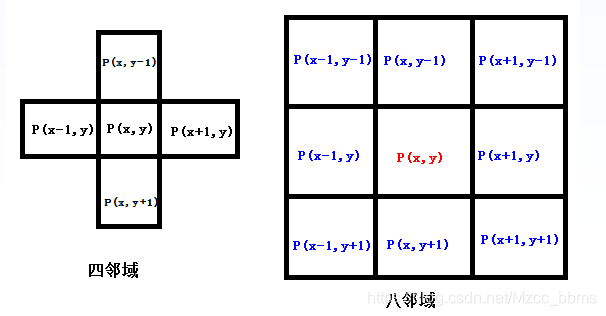
- 四领域与八领域
扫描联通组件的常见算法
- 概念
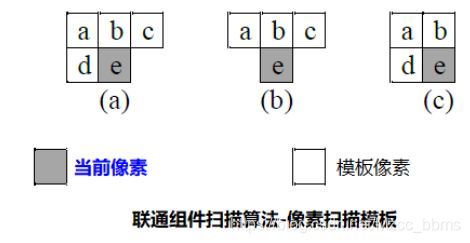
联通组件标记算法 (connected component labeling algorithm) 是图像分析中最常用的算法之一,算法的实质是扫描二值图像的每个像素点,对于像素值相同的而且相互连通分为相同的组(group),最终得到图像中所有的像素连通组件。扫描的方式可以是从上到下,从左到右,对于一幅有N个像素的图像来说,最大连通组件个数为N/2。扫描是基于每个像素单位,OpenCV中进行连通组件扫码调用的时候必须保证背景像素是黑色、前景像素是白色 - 基于像素扫描的方法
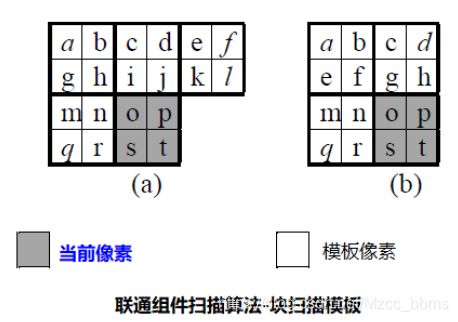
- 基于块扫描的方法
- 两步法扫描(最常用):基于扫描与等价类合并算法
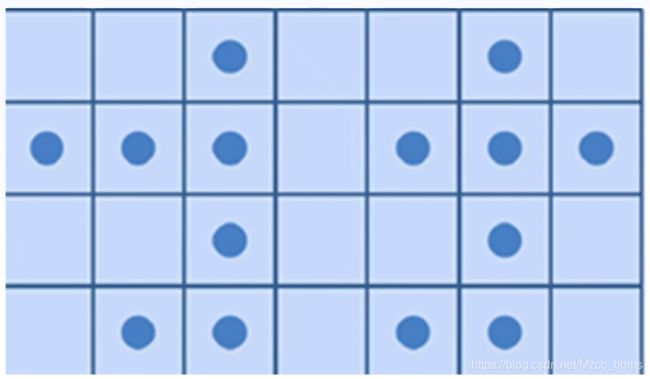
原二值图:
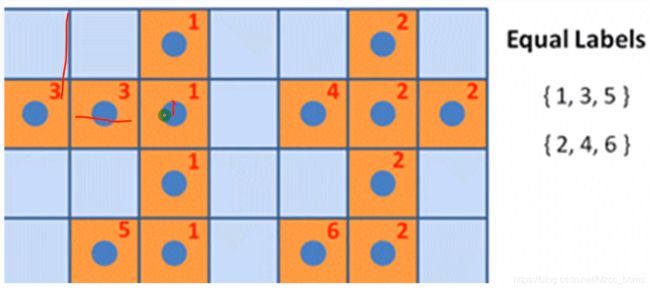
第一步:(从上到下,从左到右,扫描像素点,并进行标记,统计等价队列标签)
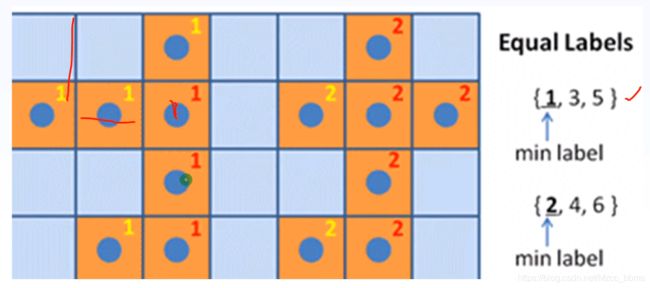
第二步:(选择每个等价队列标签中最小的标签作为联通组件的标签)
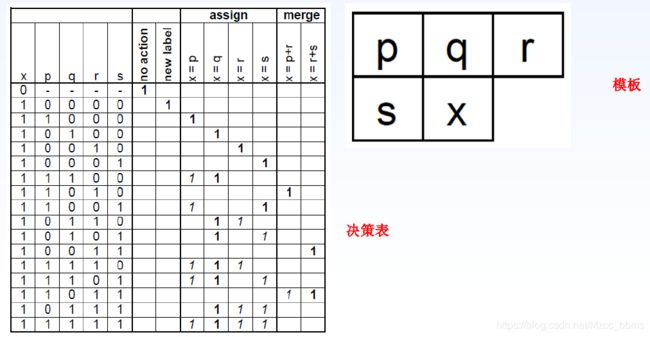
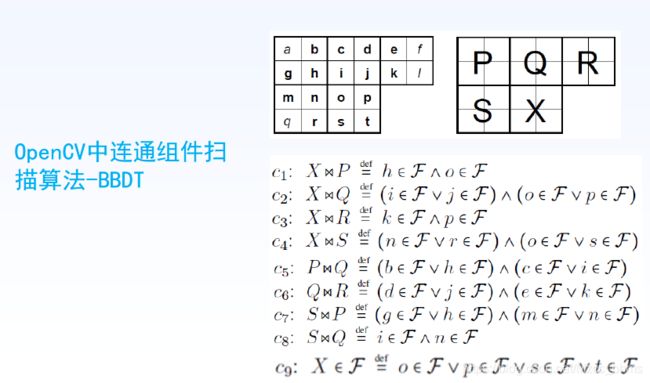
- DT算法 : 决策表 + 模板
- BBDT算法,OpenCV中采用算法
API: OpenCV中支持连通组件扫描的API有两个,一个是带统计信息connectedComponentsWithStats一个不带统计信息connectedComponents
//不带统计信息
int cv::connectedComponents(
InputArray     image, // 输入二值图像,黑色背景
OutputArray     labels, // 输出的标记图像,背景index=0
int     connectivity = 8, // 连通域,默认是8连通
int     ltype = CV_32S // 输出的labels类型,默认是CV_32S
)
//带统计信息
int cv::connectedComponentsWithStats(
InputArray     image, // 输入二值图像,黑色背景
OutputArray     labels, // 输出的标记图像,背景index = 0
OutputArray     stats, // 统计信息,包括每个组件的位置、宽、高与面积
OutputArray     centroids, // 每个组件的中心位置坐标cx, cy
int     connectivity, // 寻找连通组件算法的连通域,默认是8连通
int     ltype, // 输出的labels的Mat类型CV_32S
int     ccltype // 连通组件算法
)
其中stats包括以下枚举类型数据信息:
CC_STAT_LEFT :组件的左上角点像素点坐标的X位置
CC_STAT_TOP :组件的左上角点像素点坐标的Y位置
CC_STAT_WIDTH:组件外接矩形的宽度
CC_STAT_HEIGHT:组件外接矩形的高度
CC_STAT_AREA :当前连通组件的面积(像素单位)
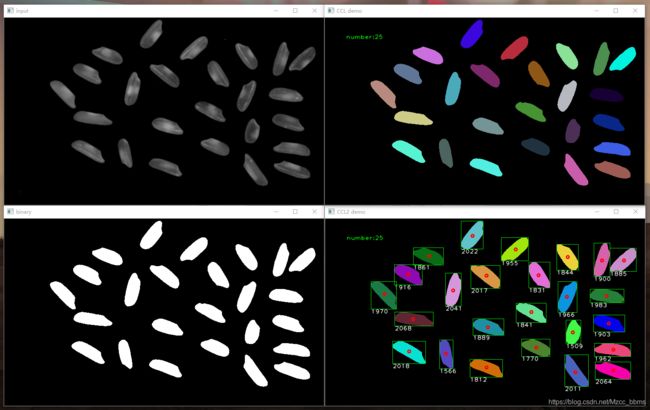
- 实例
//不带统计信息
int main(int argc, char **argv) {

	Mat src = imread("F:/code/images/rice.png");
	CV_Assert(!src.empty());
	namedWindow("input", WINDOW_AUTOSIZE);
	imshow("input", src);


	//高斯滤波 : 一般先进行高斯滤波,会得到较好的处理效果
	GaussianBlur(src, src, Size(3,3), 0);

	//得到灰度图
	Mat gray, binary;
	cvtColor(src, gray, COLOR_RGB2GRAY);
	imshow("gray", gray);

	//得到二值图
	threshold(gray, binary, 0, 255, THRESH_BINARY | THRESH_OTSU);
	imshow("binary", binary);

	//联通组件求解

	//不带统计信息的API : connectedComponents


	Mat labels = Mat::zeros(binary.size(), CV_32S);
	int num_labels = connectedComponents(binary, labels, 8, CV_32S, CCL_DEFAULT);//CCL_DEFAULT 是使用的 CCL_GRANA  (BBDT)
	printf("total labels: %d\n", num_labels - 1);//ps:返回值label的个数是包含背景色的,因此减1才是前景label的个数

	//color table
	vector<Vec3b> colorTable(num_labels);
	//background color 黑色
	colorTable[0] = Vec3b(0, 0, 0);
	//front color 随机颜色
	for (int i = 1; i < num_labels; i++) {
		colorTable[i] = Vec3b(rng.uniform(0, 256), rng.uniform(0, 256), rng.uniform(0, 256));
	}

	//用colorTable 对 labels 进行着色
	Mat result = Mat::zeros(src.size(), src.type());
	int w = result.cols;
	int h = result.rows;
	for (int row = 0; row < h; row++) {
		for (int col = 0; col < w; col++) {
			int label = labels.at<int>(row, col);
			result.at<Vec3b>(row, col) = colorTable[label];
		}
	}
	putText(result, format("number:%d", num_labels - 1), Point(50, 50), FONT_HERSHEY_PLAIN, 1.0, Scalar(0,255,0), 1, LINE_AA);
	imshow("CCL demo", result);

	//带统计信息的API
	ccl_stats_demo(binary);

	waitKey(0);
	destroyAllWindows();
	return 0;
}
//带统计信息:写到一个函数里面
void ccl_stats_demo(Mat &binary) {

	Mat labels = Mat::zeros(binary.size(), CV_32S);
	Mat stats, centroids;
	int num_labels = connectedComponentsWithStats(binary, labels, stats, centroids, 8, CV_32S, CCL_DEFAULT);

	//color table
	vector<Vec3b> colorTable(num_labels);
	//background color 黑色
	colorTable[0] = Vec3b(0, 0, 0);
	//front color 随机颜色
	for (int i = 1; i < num_labels; i++) {
		colorTable[i] = Vec3b(rng.uniform(0, 256), rng.uniform(0, 256), rng.uniform(0, 256));
	}

	//用colorTable 对 labels 进行着色
	Mat result = Mat::zeros(binary.size(), CV_8UC3);
	int w = result.cols;
	int h = result.rows;
	for (int row = 0; row < h; row++) {
		for (int col = 0; col < w; col++) {
			int label = labels.at<int>(row, col);
			result.at<Vec3b>(row, col) = colorTable[label];
		}
	}

	//获取信息 并进行绘制
	for (int i = 1; i < 2; i++) {
		//center position
		int cx = centroids.at<double>(i, 0);
		int cy = centroids.at<double>(i, 1);
		//rectangle and area
		int x = stats.at<int>(i, CC_STAT_LEFT);
		int y = stats.at<int>(i, CC_STAT_TOP);
		int width = stats.at<int>(i, CC_STAT_WIDTH);
		int height = stats.at<int>(i, CC_STAT_HEIGHT);
		printf("width:%d,height:%d\n", width, height);
		int area = stats.at<int>(i, CC_STAT_AREA);

		//绘制中心
		circle(result, Point(cx, cy), 3, Scalar(0,0,255), 2, 8, 0);
		//外接矩形
		Rect box(x, y, width, height);
		rectangle(result, box, Scalar(0, 255, 0), 1, 8, 0);
		putText(result, format("%d", area), Point(x, y + height +10), FONT_HERSHEY_PLAIN, 1.0, Scalar(255, 255, 255), 1, LINE_AA);
	}

	putText(result, format("number:%d", num_labels - 1), Point(50, 50), FONT_HERSHEY_PLAIN, 1.0, Scalar(0, 255, 0), 1, LINE_AA);
	imshow("CCL2 demo", result);
}
思考
我们已经找到了二值图中所有的联通组件,那么这些联通组件互相之间有什么关系呢,是包含还是独立,还是具有其他一些关系?我们怎么进行发现呢?