内存检测工具——LeakDiag
LeakDiag是微软一款检测memory leak的工具
LDGrapher可以比较两个xml文件(LeakDiag生成的log文件)
LeakDiag下载地址: http://www.cnblogs.com/lzx_ok/admin/ftp://ftp.microsoft.com/PSS/Tools/Developer%20Support%20Tools/LeakDiag/
LeakDiag下载地址: http://www.cnblogs.com/lzx_ok/admin/ftp://ftp.microsoft.com/PSS/Tools/Developer%20Support%20Tools/LeakDiag/
LDGrapher下载
地址:ftp://ftp.microsoft.com/PSS/Tools/Developer%20Support%20Tools/LDGrapher/
安装好,默认是在c:\leakdiag
然后写一个测试程序来测试
安装好,默认是在c:\leakdiag
然后写一个测试程序来测试
#include
<
stdio.h
>
#include < windows.h >
int main()
{
while ( 1 )
{
char * c = new char [ 10 ];
printf( " %s " ,c);
Sleep( 1000 );
}
return 0 ;
}
#include < windows.h >
int main()
{
while ( 1 )
{
char * c = new char [ 10 ];
printf( " %s " ,c);
Sleep( 1000 );
}
return 0 ;
}
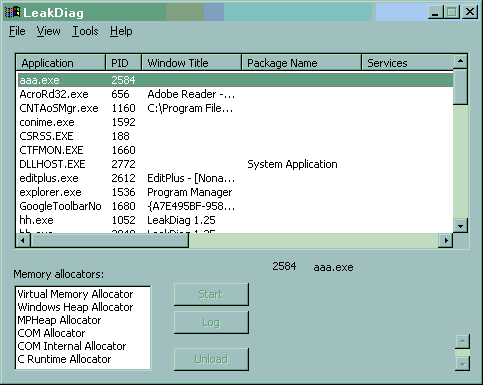
在LeakDiag中选择aaa.exe
然后选择Windows Heap Allocator来跟踪heap的使用,按start开始,等一会按log,然后再stop
会在c:\leakdiag\Logs下面生成一个log
关键的部分是
<
LEAKS
ver
="1.25.28.2201"
>
< STACK numallocs ="05" size ="048" totalsize ="0240" >
< STACKSTATS >
< SIZESTAT size ="048" numallocs ="05" />
< HEAPSTAT handle ="340000" numallocs ="05" />
</ STACKSTATS >
< FRAME num ="0" dll ="aaa.exe" function ="" filename ="" line ="" addr ="0x407a72" offset ="0x00007A72" />
< FRAME num ="1" dll ="aaa.exe" function ="" filename ="" line ="" addr ="0x402ff2" offset ="0x00002FF2" />
< FRAME num ="2" dll ="aaa.exe" function ="" filename ="" line ="" addr ="0x402df9" offset ="0x00002DF9" />
< FRAME num ="3" dll ="aaa.exe" function ="" filename ="" line ="" addr ="0x402dd6" offset ="0x00002DD6" />
< FRAME num ="4" dll ="aaa.exe" function ="" filename ="" line ="" addr ="0x40112f" offset ="0x0000112F" />
< FRAME num ="5" dll ="aaa.exe" function ="" filename ="" line ="" addr ="0x401038" offset ="0x00001038" />
< FRAME num ="6" dll ="aaa.exe" function ="" filename ="" line ="" addr ="0x401269" offset ="0x00001269" />
< FRAME num ="7" dll ="KERNEL32.dll" function ="GetSortTablesFileInfo" offset ="0xC" filename ="" line ="" addr ="0x7C5989D5" />
< STACKID > 00524008 </ STACKID >
</ STACK >
</ LEAKS >
其中numallocs是分配的次数,size是每次分配的大小,frame则是leak的时候的call stack
这里的stack只显示了binary,是因为symbol没有配好
把对应的pdb文件路径加到[Tools]-[Option]-Symbol search path,就能得到
<
LEAKS
ver
="1.25.28.2201"
>
< STACK numallocs ="06" size ="048" totalsize ="0288" >
< STACKSTATS >
< SIZESTAT size ="048" numallocs ="06" />
< HEAPSTAT handle ="340000" numallocs ="06" />
</ STACKSTATS >
< FRAME num ="0" dll ="aaa.exe" function ="_heap_alloc_base" offset ="0xC2" filename ="malloc.c" line ="200" addr ="0x407A72" />
< FRAME num ="1" dll ="aaa.exe" function ="_heap_alloc_dbg" offset ="0x1A2" filename ="dbgheap.c" line ="378" addr ="0x402FF2" />
< FRAME num ="2" dll ="aaa.exe" function ="_nh_malloc_dbg" offset ="0x19" filename ="dbgheap.c" line ="248" addr ="0x402DF9" />
< FRAME num ="3" dll ="aaa.exe" function ="_nh_malloc" offset ="0x16" filename ="dbgheap.c" line ="197" addr ="0x402DD6" />
< FRAME num ="4" dll ="aaa.exe" function ="operator new" offset ="0xF" filename ="new.cpp" line ="24" addr ="0x40112F" />
< FRAME num ="5" dll ="aaa.exe" function ="main" offset ="0x28" filename ="D:\Test\aaa\test.cpp" line ="8" addr ="0x401038" />
< FRAME num ="6" dll ="aaa.exe" function ="mainCRTStartup" offset ="0xE9" filename ="crt0.c" line ="206" addr ="0x401269" />
< STACKID > 00524008 </ STACKID >
</ STACK >
</ LEAKS >
由test.cpp line 8引起的memory leak.