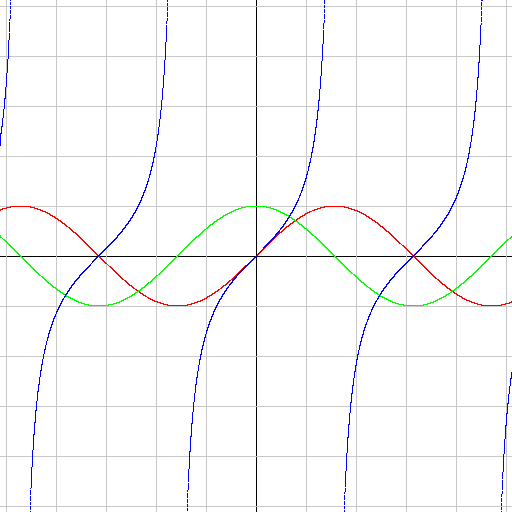
通过 Python + Python Imaging Library (PIL) 生成简单函数图像
#
!/usr/bin/env python
# coding=utf-8
# -------------------------------------------------------------------------------
# 名 称:简单函数绘制类
# 版 本:V0.1
# 作 者:mapig (http://mapig.cnblogs.com QQ:33221979)
# 功 能:生成简单函数图像
# 创 建:2009-05-18
# 备 注:需要 Python Imaging Library (PIL)
# -------------------------------------------------------------------------------
import math
import Image
import ImageDraw
class DrawFun():
# 画布像素尺寸
width = 512
height = 512
# X取值范围
min = - 10
max = 10
# X的步长值
step = 1
# X单位值像素
unit = 1
# 画板对象
canvas = None
# 画笔对象
draw = None
# 画布中心值偏移值
ctrx = 0
ctry = 0
def __init__ (self, width, height, min, max, step, unit):
self.width = width
self.height = height
self.min = min
self.max = max
self.step = step
self.unit = unit
# 创建画板对象
self.canvas = Image.new( " RGB " , [self.width, self.height],( 255 , 255 , 255 ))
# 创建画笔对象
self.draw = ImageDraw.Draw(self.canvas)
# 获取画布中心点
self.ctrx = math.floor(self.width / 2 )
self.ctry = math.floor(self.height / 2 )
# 绘制中心轴线
self.draw.line([(0,self.ctry),(self.width,self.ctry)], fill = (0,0,0))
self.draw.line([(self.ctrx,0),(self.ctrx,self.height)], fill = (0,0,0))
# 显示单元格数 左右对称计算
viewx = int(math.floor((self.width / self.unit + 1 ) / 2 ))
viewy = int(math.floor((self.height / self.unit + 1 ) / 2 ))
# 绘制单元格
for x in range( 1 ,viewx + 1 ):
offsetx = x * self.unit
self.draw.line([(self.ctrx + offsetx,0),(self.ctrx + offsetx,self.height)], fill = ( 200 , 200 , 200 ))
self.draw.line([(self.ctrx - offsetx,0),(self.ctrx - offsetx,self.height)], fill = ( 200 , 200 , 200 ))
for y in range( 1 ,viewy + 1 ):
offsety = y * self.unit
self.draw.line([(0,self.ctry + offsety),(self.width,self.ctry + offsety)], fill = ( 200 , 200 , 200 ))
self.draw.line([(0,self.ctry - offsety),(self.width,self.ctry - offsety)], fill = ( 200 , 200 , 200 ))
def paint(self, fun, color):
# 结果点集
aryPoint = []
# 转换为1为步长
min = int(math.floor(self.min / self.step))
max = int(math.floor(self.max / self.step))
for i in range(min, max):
# 实际函数值
x = i * self.step
y = fun(x)
# 笛卡尔坐标系到屏幕坐标系
# 比例变换
x = x * self.unit
y = y * self.unit
# 坐标变换
curX = self.ctrx + x
curY = self.ctry - y
# 保存坐标到数组
aryPoint.append((curX,curY))
# 绘制函数
self.draw.point(aryPoint,fill = color)
# 显示图片
def show(self):
# 显示图片
self.canvas.show()
# 保存到JPG
def saveToJPG(self, path):
self.canvas.save(path, " JPEG " )
# 保存到PNG
def saveToPNG(self, path):
self.canvas.save(path, " PNG " )
def sin(x):
return math.sin(x)
def cos(x):
return math.cos(x)
def tan(x):
return math.tan(x)
if __name__ == " __main__ " :
# DrawFun("画布宽度","画布高度","x最小值","x最大值","x步长值","x单位值像素大小")
drawfun = DrawFun( 512 , 512 , - 10 , 10 , 0.001 , 50 )
# DrawFun.paint(f(x)函数,RGB颜色)
drawfun.paint(sin,( 255 ,0,0))
drawfun.paint(cos,(0, 255 ,0))
drawfun.paint(tan,(0,0, 255 ))
# 显示函数图像
drawfun.show()
# 保存到图片
drawfun.saveToJPG( " demo.jpg " )
drawfun.saveToPNG( " demo.png " )
生成效果
