Python 数据分析— Pandas 基本操作(上)
文章目录
- 学习内容:
-
- 一、Series 创建及操作
- 二、DataFram 的创建与操作
- 三、Pandas 的读写操作
- 四、选择指定行列数据
学习内容:
一、Series 创建及操作
** Series : Pandas 的一种数据结构形式,可理解为含有索引的一维数组。**
**(一)创建 Series ** pd.Series(数据 [, index=自定义索引(默认为0-N), copy=Flase默认 | True ->(当copy=False时,如果原始数据是np.array时,Series 值的更改为改变原数组对应元素)])
1. 通过列表或数组创建
import pandas as pd
list_a = range(10,13)
#list_a = np.arange(10,13)
pd.Series(data=list_a)
#输出:	0    10
#		1    11
#		2    12
#		dtype: int64
pd.Series(list_a, index=['a', 'b', 'c']) # 指定索引数必须与元素相等
#输出:	a    10
#		b    11
#		c    12
#		dtype: int64
2. 通过字典创建索引
dict_a = {'d': 1, 'e': 2, 'f': 3}
pd.Series(dict_a)
#输出:	d    1
#		e    2
#		f    3
#		dtype: int64
pd.Series(dict_a, index=['e', 'f', 'g']) #当指定索引与字典键相同时,值为字典值;字典无时,值为NaN
#输出:	e    2.0
#		f    3.0
#		g    NaN
#		dtype: float64
(二)Series 相关操作
1. 获取索引或值
dict_a = {'d': 1, 'e': 2, 'f': 3}
s_a = pd.Series(dict_a)
#1.获取索引
s_a.index # 返回 Index(['d', 'e', 'f'], dtype='object')
#2.获取数据
s_a.values # 返回 array([1, 2, 3])
2. 与整数加、减、乘、除
计算方法为: 各项分别与整数进行对应运算,返回新Series
s_x = pd.Series([10,11,12])
s_x + 5
#返回:	0    15
#		1    16
#		2    17
#		dtype: int64
3. Series 之间进行加、减、乘、除
计算方法为: 同索引号元素进行对应运算,差异索引返回NaN
s_A = pd.Series([1,2,3],index = ['a','b','c'])
s_B = pd.Series([4,5,6],index = ['b','c','d'])
s_A * s_B
#返回:	a    0.5
#		b    1.0
#		c    1.5
#		d    2.0
#		e    2.5
#		dtype: float64
4. 按条件筛选
a = range(0, 50)
s_a = pd.Series(a)
s_a > 40 # 将每个值与40比较,大于为真,小于为假
#输出举例:
#0     False
#……
#40    False
#41    True
#……

#输出符合条件的数值
s_a[s_a > 40].values
#输出:array([41, 42, 43, 44, 45, 46, 47, 48, 49])
s_a[s_a%7 == 0].values
#输出:array([ 0,  7, 14, 21, 28, 35, 42, 49])
二、DataFram 的创建与操作
DataFram: Pandas 的一种数据结构形式,类似于表格,由若干个具有共同索引的 Series 组成,每个Series还有列索引。
DataFram 示例:
	a	b	c
d	1	2	3
e	4	5	6
f	7	8	9
**( 一)创建 DataFrame ** pd.DataFrame(data数据=数组 | 字典 [, index行索引, columns列索引])
1. 通过数组创建
arr = np.array([[1, 2, 3], [4, 5, 6], [7, 8, 9]])
pd.DataFrame(arr) #未指定索引,默认用从0开始的序列
'''输出:
	0	1	2
0	1	2	3
1	4	5	6
2	7	8	9'''
pd.DataFrame(arr, columns=['a','b','c'], index=['d','e','f']) #指定行列索引
'''输出:
	a	b	c
d	1	2	3
e	4	5	6
f	7	8	9'''
2. 通过字典创建
d = {'col1': [1, 2], 'col2': [3, 4]}
pd.DataFrame(data=d)
'''输出:
	col1	col2
0	1	3
1	2	4'''
(二)常用操作
1. 查看头数据(head(n=前n行,默认为5))
df = pd.DataFrame({'col1':range(10)})
'''df结构:
	col1
0	0
1	1
2	2
……
9	9'''
df.head() #查看前5行
'''输出:
	col1
0	0
1	1
2	2
3	3
4	4'''
df.head(3) #查看前3行
'''输出:
col1
0	0
1	1
2	2'''
2. 查看尾数据(tail(n))用法同 head
df = pd.DataFrame({'col1':range(10)})
df.tail(2) #查看后两行
'''输出:
	col1
8	8
9	9'''
3. 查看数据结构和存储信息(info()
dict1={'品名':['矿泉水','纸巾','毛巾'],
    '单价':[2,1,15],
    '数量':[100,150,30],
    '总价':[200,150,450]}
df_商品 = pd.DataFrame(dict1)
df_商品.info()
'''输出:

RangeIndex: 3 entries, 0 to 2
Data columns (total 4 columns):
 #   Column  Non-Null Count  Dtype
---  ------  --------------  -----
 0   品名      3 non-null      object
 1   单价      3 non-null      int64
 2   数量      3 non-null      int64
 3   总价      3 non-null      int64
dtypes: int64(3), object(1)
memory usage: 224.0+ bytes'''
4. 查看数据按列统计信息(describe())
df_商品.describe()
'''输出:
		单价		数量			总价
count	3.00000	3.000000	3.000000
mean	6.00000	93.333333	266.666667
std		7.81025	60.277138	160.727513
min		1.00000	30.000000	150.000000
25%		1.50000	65.000000	175.000000
50%		2.00000	100.000000	200.000000
75%		8.50000	125.000000	325.000000
max		15.00000	150.000000	450.000000'''
5. 查看每列:均值(mean())、中位数(median())、最大值(max())、最小值(min())、和(sum())
df_商品.mean()
'''输出:
单价      6.000000
数量     93.333333
总价    266.666667
dtype: float64'''
6. 数据排序:
按行索引排序(sort_index(axis=0或’index’行索引 | 1或’colunms’列索引))
df_商品.sort_index(axis=0) # 按行索引排序
按列索引排序(sort_values(by=列索引 [, ascending=True升序 | False降序]))
df_商品.sort_values('数量') # 按数量升序排序
'''输出:
	品名		单价	数量	总价
2	毛巾		15	30	450
0	矿泉水	2	100	200
1	纸巾		1	150	150'''
7. 数据转置(T)
df_商品.T
'''输出:
	0		1	2
品名	矿泉水	纸巾	毛巾
单价	2		1	15
数量	100		150	30
总价	200		150	450'''
8. 获取行索引(index)、列索引(columns)
df_商品.columns
#输出: Index(['品名', '单价', '数量', '总价'], dtype='object')
(三) DataFrame 与 Series 间的转化
1. DataFrame 转 Series
dict1={'品名':['矿泉水','纸巾','毛巾'],
    '单价':[2,1,15],
    '数量':[100,150,30],
    '总价':[200,150,450]}
df_商品 = pd.DataFrame(dict1)
df_商品['单价']
'''输出:
0     2
1     1
2    15
Name: 单价, dtype: int64'''
type(df_商品['单价'])
#输出:pandas.core.series.Series
2. Series 组成 DataFrame
pm = pd.Series(['矿泉水','纸巾','毛巾'])
sl = pd.Series([100,150,30])
dj = pd.Series([2,1,15])
pd.DataFrame([pm,sl,dj],index=['品名','数量','单价']).T
'''输出:
	品名		数量	单价
0	矿泉水	100	2
1	纸巾		150	1
2	毛巾		30	15'''
3. 逐行读取表格值(iterrows() ->迭代返回各行索引和值)
df = pd.DataFrame([pm,sl,dj],index=['品名','数量','单价']).T
for index, content in df.iterrows():
    pm, sl, dj = content
    print(sl)
    print(dj)
'''输出:
100
2
150
1
30
15'''
三、Pandas 的读写操作
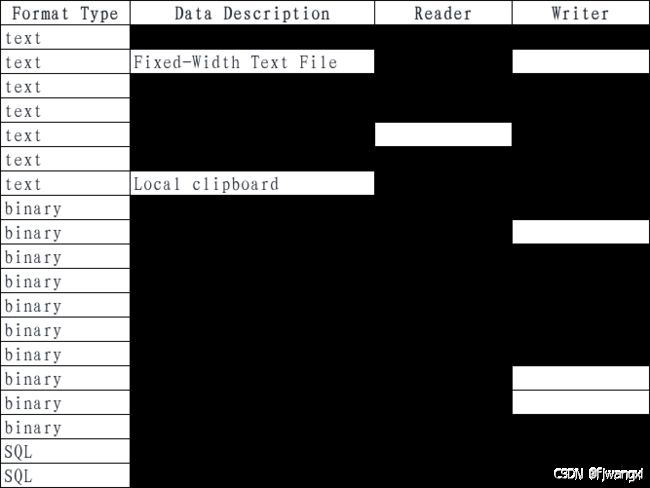
Pandas 通过(read_文件类型())和(to_文件类型())读取和写入表格(DataFrame),支持类型如下:

1. 读取 Excel 文件(pd.read_excel(io=文件路径+文件名 [,sheet_name=工作表名,默认第1张表]))
(电子表格与程序在于同一目录,内容同上图)
df = pd.read_excel('test.xlsx')
df.head(3) # 前3行信息
'''输出:
	Format Type	Data Description		Reader		Writer
0	text		CSV						read_csv	to_csv
1	text		Fixed-Width Text File	read_fwf	NaN
2	text		JSON					read_json	to_json'''
2. 写入到Excel 文件(pd.to_excel(文件名 [,index=True写入行索引 默认 | False 不写入),header=是否写入列索引)
df2 = df.head(3)
#将前3行输出为新表
df2.to_excel('test2.xlsx',index=False)
四、选择指定行列数据
(一)根据行、列索引名选择 (loc[行索引名 , 列索引名])
arr = np.arange(16).reshape(4,4)
df = pd.DataFrame(arr, index=['a','b','c','d'], columns=['e','f','g','h'])
'''df结构:
	e	f	g	h
a	0	1	2	3
b	4	5	6	7
c	8	9	10	11
d	12	13	14	15'''
# df.loc[:,:]  返回所有数据
# df.loc[:3,:] 返回前4行 (0,1,2,3)
# df.loc[:,'前区1']   返回  Series
# df.loc[:,['前区1']] 返回  DataFrame
df.loc[ :'c', 'e':'g'] #返回前3行,前3列数据 同 df.loc[['a','b','c'], ['e','f','g']]
'''输出:
	e	f	g
a	0	1	2
b	4	5	6
c	8	9	10'''
(二)根据行、列位置选择 (iloc[行位置,列位置)
#用iloc返回前2行2列数据
df.iloc[:2, :2]
'''输出:
	e	f
a	0	1
b	4	5'''