R语言 线性回归(上)
一、一元线性回归
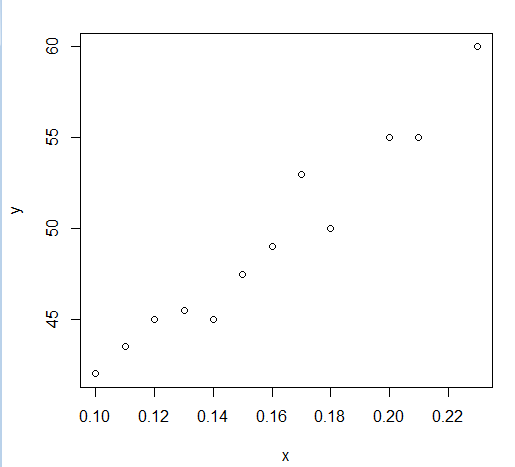
> x <- c(0.10,0.11,0.12,0.13,0.14,0.15,0.16,0.17,0.18,0.20,0.21,0.23)
> y <- c(42.0,43.5,45.0,45.5,45.0,47.5,49,53,50,55,55,60)
> plot(y~x)
> mod <- lm(y ~ 1 + x) #1可以不写,代表截距项。 如果写成-1 表示强制过原点。
> summary(mod)

Call:
lm(formula = y ~ 1 + x)

Residuals:
    Min      1Q  Median      3Q     Max  #残差的fivenum
-2.0431 -0.7056  0.1694  0.6633  2.2653

Coefficients: #估计值  标准差  t值   p值
            Estimate Std. Error t value Pr(>|t|)
(Intercept)   28.493      1.580   18.04 5.88e-09 ***
x            130.835      9.683   13.51 9.50e-08 ***
---
Signif. codes:  0 ‘***’ 0.001 ‘**’ 0.01 ‘*’ 0.05 ‘.’ 0.1 ‘ ’ 1

Residual standard error: 1.319 on 10 degrees of freedom #残差标准差,自由度为10
Multiple R-squared:  0.9481,    Adjusted R-squared:  0.9429 #调整
F-statistic: 182.6 on 1 and 10 DF,  p-value: 9.505e-08 #f统计量和p值。
有时,还要对估计值做区间估计。编写下面的函数:
beta.int <- function(fm,alpha=0.05){
  A <- summary(fm)$coefficients
  df <- fm$df.residual
  left <- A[,1]-A[,2]*qt(1-alpha/2, df)      #这里因为 (β估-β)/sd(β估)服从n-2的t分布
  right <- A[,1]+A[,2]*qt(1-alpha/2, df)
  rowname <- dimnames(A)[[1]]
  colname <- c("Estimate", "Left", "Right")
  matrix(c(A[,1], left, right), ncol=3,
  dimnames = list(rowname, colname ))
}
对上面做出的模型使用
> beta.int(mod)
             Estimate      Left     Right
(Intercept)  28.49282  24.97279  32.01285
x           130.83483 109.25892 152.41074
模型建立好后可以进行预测:
> newX <- data.frame(x=0.16) #新数据要是frame
> predict(mod,newdata=newX,interval="prediction",level=0.95) #interval=pred表示要给出置信区间
       fit      lwr      upr
1 49.42639 46.36621 52.48657
Formular的语法:
语法                    模型                              备注
Y ~ A                  Y = β0 + β1A                      带y截距的直线
Y ~ -1 + A             Y = β1A                           没有截距的直线,即强制通过原点
Y ~ A + I(A^2)         Y = β0 + β1A + β2A2               多项式模型。注意函数I()允许常规数学符号
Y ~ A + B              Y = β0 + β1A + β2B                没有交互项的A和B一阶模型
Y ~ A:B                Y = β0 + β1AB                     仅有交互项的A和B一阶模型
Y ~ A*B                Y = β0 + β1A + β2B + β3AB         A和B全一阶模型,等同于:Y ~ A + B + A:B
Y ~ (A+B+C) ^2         Y = β 0+ β1A + β2B + β3C + β4AB + β5BC + β6AC
plot(mod)将画出四张图。第一张:残差~拟合值。第二张:残差qq图。第三张:标准化残差对拟合值,用于判断是否等方差。第四张是标准化残差对杠杆值,虚线表示的cooks距离等高线。
abline(mod)画出模型的直线。
Forbes认为 气压和水的沸点存在线性关系:
其中第三列数据是由log10( )函数计算得来的对数。第四列将该数乘以100,因为第三列的数据差别太小。现在对气压和沸点的自然对数的100倍做线性回归:
x <- c(194.5,194.3,197.9,198.4,199.4,199.9,200.9,201.1,201.4,201.3,203.6,204.6,209.5,208.6,210.7,211.9,212.2)
y <- c(20.79,20.79,22.4,22.67,23.15,23.35,23.89,23.99,24.02,24.01,25.14,26.57,28.49,27.76,29.04,29.88,30.06)
> mydata <- data.frame(feidian=x,qiya=log10(y)*100)
> mod <- lm(qiya~feidian,data=mydata)
> summary(mod)

Call:
lm(formula = qiya ~ feidian, data = mydata)

Residuals:
     Min       1Q   Median       3Q      Max
-0.31974 -0.14707 -0.06890  0.01877  1.35994

Coefficients:
             Estimate Std. Error t value Pr(>|t|)
(Intercept) -42.16418    3.34136  -12.62 2.17e-09 ***
feidian       0.89562    0.01646   54.42  < 2e-16 ***
---
Signif. codes:  0 ‘***’ 0.001 ‘**’ 0.01 ‘*’ 0.05 ‘.’ 0.1 ‘ ’ 1

Residual standard error: 0.3792 on 15 degrees of freedom
Multiple R-squared:  0.995,     Adjusted R-squared:  0.9946
F-statistic:  2962 on 1 and 15 DF,  p-value: < 2.2e-16

#看起来模型还不错。画一下残差图。
>plot(mod)
lm(qiya~feidian,data=mydata[-12,])
二、多元线性回归
略
三、逐步回归
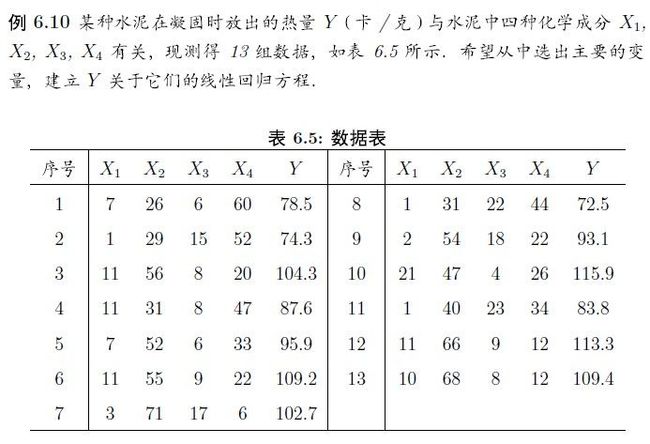
> cement <- data.frame(
+ x1=c(7,1,11,11,7,11,3,1,2,21,1,11,10),
+ x2=c(26,29,56,31,52,55,71,31,54,47,40,66,68),
+ x3=c(6,15,8,8,6,9,17,22,18,4,23,9,8),
+ x4=c(60,52,20,47,33,22,6,44,22,26,34,12,12),
+ y=c(78.5,74.3,104.3,87.6,95.9,109.2,102.7,72.5,93.1,115.9,83.8,113.3,109.4))

> lm.sol <- lm(y ~ x1 + x2 + x3 + x4,data=cement)
> summary(lm.sol)

Call:
lm(formula = y ~ x1 + x2 + x3 + x4, data = cement)

Residuals:
    Min      1Q  Median      3Q     Max
-3.1750 -1.6709  0.2508  1.3783  3.9254

Coefficients:
            Estimate Std. Error t value Pr(>|t|)
(Intercept)  62.4054    70.0710   0.891   0.3991
x1            1.5511     0.7448   2.083   0.0708 .
x2            0.5102     0.7238   0.705   0.5009
x3            0.1019     0.7547   0.135   0.8959
x4           -0.1441     0.7091  -0.203   0.8441
---
Signif. codes:  0 ‘***’ 0.001 ‘**’ 0.01 ‘*’ 0.05 ‘.’ 0.1 ‘ ’ 1

Residual standard error: 2.446 on 8 degrees of freedom
Multiple R-squared:  0.9824,    Adjusted R-squared:  0.9736
F-statistic: 111.5 on 4 and 8 DF,  p-value: 4.756e-07
#四个估计值都不理想,尝试逐步回归
> lm.step <- step(lm.sol)
Start:  AIC=26.94
y ~ x1 + x2 + x3 + x4

       Df Sum of Sq    RSS    AIC
- x3    1    0.1091 47.973 24.974
- x4    1    0.2470 48.111 25.011
- x2    1    2.9725 50.836 25.728
<none>              47.864 26.944
- x1    1   25.9509 73.815 30.576 #表示所有的变量都用上,AIC值为26.944,去掉x3 变为24.974 类推

Step:  AIC=24.97
y ~ x1 + x2 + x4

       Df Sum of Sq    RSS    AIC
<none>               47.97 24.974
- x4    1      9.93  57.90 25.420
- x2    1     26.79  74.76 28.742
- x1    1    820.91 868.88 60.629 #这里去掉x3后,再去掉任意变量,都会使AIC值增大。
#尝试去掉x3
> lm.update <- update(lm.sol,. ~ . - x3)
> summary(lm.update)

Call:
lm(formula = y ~ x1 + x2 + x4, data = cement)

Residuals:
    Min      1Q  Median      3Q     Max
-3.0919 -1.8016  0.2562  1.2818  3.8982

Coefficients:
            Estimate Std. Error t value Pr(>|t|)
(Intercept)  71.6483    14.1424   5.066 0.000675 ***
x1            1.4519     0.1170  12.410 5.78e-07 ***
x2            0.4161     0.1856   2.242 0.051687 .
x4           -0.2365     0.1733  -1.365 0.205395
---
Signif. codes:  0 ‘***’ 0.001 ‘**’ 0.01 ‘*’ 0.05 ‘.’ 0.1 ‘ ’ 1

Residual standard error: 2.309 on 9 degrees of freedom
Multiple R-squared:  0.9823,    Adjusted R-squared:  0.9764
F-statistic: 166.8 on 3 and 9 DF,  p-value: 3.323e-08
#看到 x4仍然不理想。在R软件中,还有add1()和drop1()方法,尝试去掉一个变量。
> drop1(lm.update)
Single term deletions

Model:
y ~ x1 + x2 + x4
       Df Sum of Sq    RSS    AIC
<none>               47.97 24.974
x1      1    820.91 868.88 60.629
x2      1     26.79  74.76 28.742
x4      1      9.93  57.90 25.420  去掉变量x4残差平方和增大9.93,AIC增长也是最小的,所以去掉x4

> lm.final <- update(lm.update,. ~ . - x4)
> summary(lm.final)

Call:
lm(formula = y ~ x1 + x2, data = cement)

Residuals:
   Min     1Q Median     3Q    Max
-2.893 -1.574 -1.302  1.363  4.048

Coefficients:
            Estimate Std. Error t value Pr(>|t|)
(Intercept) 52.57735    2.28617   23.00 5.46e-10 ***
x1           1.46831    0.12130   12.11 2.69e-07 ***
x2           0.66225    0.04585   14.44 5.03e-08 ***
---
Signif. codes:  0 ‘***’ 0.001 ‘**’ 0.01 ‘*’ 0.05 ‘.’ 0.1 ‘ ’ 1

Residual standard error: 2.406 on 10 degrees of freedom
Multiple R-squared:  0.9787,    Adjusted R-squared:  0.9744
F-statistic: 229.5 on 2 and 10 DF,  p-value: 4.407e-09
#最后得到了较好的结果。
四、回归诊断
各种指标,也看不太明白。
Reg_Diag<-function(fm){
  n <- nrow(fm$model); df <- fm$df.residual
  p <- n-df-1; s<-rep(" ", n);
  res <- residuals(fm); s1 <- s; s1[abs(res)==max(abs(res))] <- "*"
  sta <- rstandard(fm); s2 <- s; s2[abs(sta) > 2] <- "*"
  stu <- rstudent(fm); s3 <- s; s3[abs(sta) > 2] <- "*"
  h <- hatvalues(fm); s4 <- s; s4[h > 2*(p+1)/n] <- "*"
  d <- dffits(fm); s5 <- s; s5[abs(d) > 2*sqrt((p+1)/n)] <- "*"
  c <- cooks.distance(fm); s6 <- s; s6[c==max(c)] <- "*"
  co <- covratio(fm); abs_co <- abs(co-1)
  s7 <- s; s7[abs_co==max(abs_co)] <- "*"
  data.frame(residual=res, s1, standard=sta, s2,
  student=stu, s3, hat_matrix=h, s4,
  DFFITS=d, s5,cooks_distance=c, s6,
  COVRATIO=co, s7)
}
> intellect <- data.frame(x=c(15,26,10,9,15,20,18,11,8,20,7
+ ,9,10,11,11,10,12,42,17,11,10),
+ y=c(95,71,83,91,102,87,93,100,104,94,113,96,83,84,102,100,105,57,
+ 121,86,100))
> lm.sol <- lm(y ~ x, data=intellect)
> summary(lm.sol)

Call:
lm(formula = y ~ x, data = intellect)

Residuals:
    Min      1Q  Median      3Q     Max
-15.604  -8.731   1.396   4.523  30.285

Coefficients:
            Estimate Std. Error t value Pr(>|t|)
(Intercept) 109.8738     5.0678  21.681 7.31e-15 ***
x            -1.1270     0.3102  -3.633  0.00177 **
---
Signif. codes:  0 ‘***’ 0.001 ‘**’ 0.01 ‘*’ 0.05 ‘.’ 0.1 ‘ ’ 1

Residual standard error: 11.02 on 19 degrees of freedom
Multiple R-squared:   0.41,     Adjusted R-squared:  0.3789
F-statistic:  13.2 on 1 and 19 DF,  p-value: 0.001769
#残差平方和不是很好
#用上面的函数来查看是否有异常样本点。
> source("E:\\hutao\\learning\\rscript\\myR.R")
> Reg_Diag(lm.sol)
#打星号的数据可能不正常。使用R自己的函数也能做
> influence.measures(lm.sol)
Influence measures of
         lm(formula = y ~ x, data = intellect) :

     dfb.1_    dfb.x    dffit cov.r   cook.d    hat inf
1   0.01664  0.00328  0.04127 1.166 8.97e-04 0.0479
2   0.18862 -0.33480 -0.40252 1.197 8.15e-02 0.1545
3  -0.33098  0.19239 -0.39114 0.936 7.17e-02 0.0628
4  -0.20004  0.12788 -0.22433 1.115 2.56e-02 0.0705
5   0.07532  0.01487  0.18686 1.085 1.77e-02 0.0479
6   0.00113 -0.00503 -0.00857 1.201 3.88e-05 0.0726
7   0.00447  0.03266  0.07722 1.170 3.13e-03 0.0580
8   0.04430 -0.02250  0.05630 1.174 1.67e-03 0.0567
9   0.07907 -0.05427  0.08541 1.200 3.83e-03 0.0799
10 -0.02283  0.10141  0.17284 1.152 1.54e-02 0.0726
11  0.31560 -0.22889  0.33200 1.088 5.48e-02 0.0908
12 -0.08422  0.05384 -0.09445 1.183 4.68e-03 0.0705
13 -0.33098  0.19239 -0.39114 0.936 7.17e-02 0.0628
14 -0.24681  0.12536 -0.31367 0.992 4.76e-02 0.0567
15  0.07968 -0.04047  0.10126 1.159 5.36e-03 0.0567
16  0.02791 -0.01622  0.03298 1.187 5.74e-04 0.0628
17  0.13328 -0.05493  0.18717 1.096 1.79e-02 0.0521
18  0.83112 -1.11275 -1.15578 2.959 6.78e-01 0.6516   *
19  0.14348  0.27317  0.85374 0.396 2.23e-01 0.0531   *
20 -0.20761  0.10544 -0.26385 1.043 3.45e-02 0.0567
21  0.02791 -0.01622  0.03298 1.187 5.74e-04 0.0628
上面是发现异常值。下面发现多重共线性。原理也没搞太清。如果变量之间有多重共线性,那么变量矩阵的最小特征值应该很小,接近与0.但数据有时候单位很大,所以不能直接以最小的特征值来判断,而用(XT*X)最大特征值/(XT*X)最小特征值。小于100,认为多重共线性不严重,大于1000认为非常严重。
> collinear
        y x1 x2 x3 x4     x5     x6
1  10.006  8  1  1  1  0.541 -0.099
2   9.737  8  1  1  0  0.130  0.070
3  15.087  8  1  1  0  2.116  0.115
4   8.422  0  0  9  1 -2.397  0.252
5   8.625  0  0  9  1 -0.046  0.017
6  16.289  0  0  9  1  0.365  1.504
7   5.958  2  7  0  1  1.996 -0.865
8   9.313  2  7  0  1  0.228 -0.055
9  12.960  2  7  0  1  1.380  0.502
10  5.541  0  0  0 10 -0.798 -0.399
11  8.756  0  0  0 10  0.257  0.101
12 10.937  0  0  0 10  0.440  0.432
> xtx <- cor(collinear[2:7])
> kappa(xtx,exact=T)
[1] 2195.908
> eigen(xtx)
$values #这个是特征值组成的向量。 我们选最小的特征值 0.00110651来找出多重共线性。
[1] 2.428787365 1.546152096 0.922077664 0.793984690 0.307892134 0.001106051
        #最后一列是 上面最小值对应的特征向量。最后两个系数很小 忽略,
        #得出0.447x1+0.442x2+0.5416x3+0.5733x4 ≈ 0
$vectors
           [,1]        [,2]        [,3]        [,4]       [,5]        [,6]
[1,] -0.3907189  0.33968212  0.67980398 -0.07990398  0.2510370 0.447679719
[2,] -0.4556030  0.05392140 -0.70012501 -0.05768633  0.3444655 0.421140280
[3,]  0.4826405  0.45332584 -0.16077736 -0.19102517 -0.4536372 0.541689124
[4,]  0.1876590 -0.73546592  0.13587323  0.27645223 -0.0152087 0.573371872
[5,] -0.4977330  0.09713874 -0.03185053  0.56356440 -0.6512834 0.006052127
[6,]  0.3519499  0.35476494 -0.04864335  0.74817535  0.4337463 0.002166594
五、广义线性回归
放到下篇
六、非线性回归


