gperftools
以下是摘自google-code的介绍
Google Performance Tools
The fastest malloc we've seen; works particularly well with threads and STL. Also: thread-friendly heap-checker, heap-profiler, and cpu-profiler.
Overview
Perftools is a collection of a high-performance multi-threaded malloc() implementation, plus some pretty nifty performance analysis tools.
Perftools is distributed under the terms of the BSD License.
For downloads, news, and other information, visit our Project Page.
Example
Note: this is by no means complete documentation, but simply gives you an idea of what the API is like.
No recompilation is necessary to use these tools.
TC Malloc:
gcc [...] -ltcmalloc
Heap Checker:
gcc [...] -o myprogram -ltcmalloc
HEAPCHECK=normal ./myprogram
Heap Profiler:
gcc [...] -o myprogram -ltcmalloc
HEAPPROFILE=/tmp/netheap ./myprogram
Cpu Profiler:
gcc [...] -o myprogram -lprofiler
CPUPROFILE=/tmp/profile ./myprogram
Sample Output
The heap profiler can pop up a window that displays information as a directed graph:

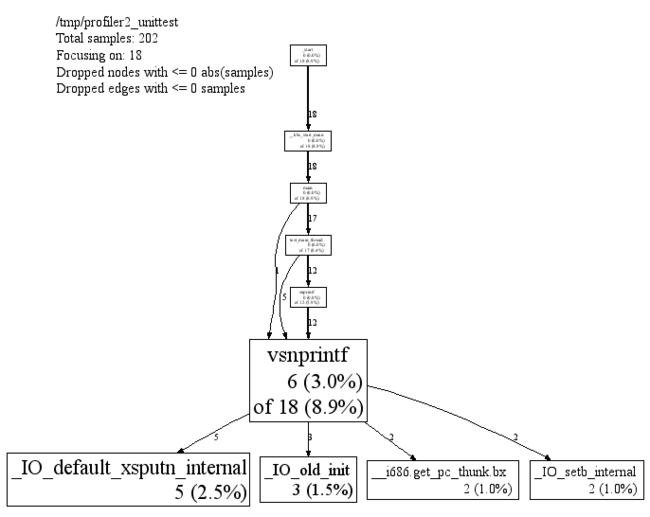
The cpu profiler can produce a weighted call graph:
Documentation
- thread-caching malloc
- heap-checking using tcmalloc
- heap-profiling using tcmalloc
- CPU profiler
Downloads
For downloads, please visit our Downloads Page.
Links to Other Sites
Russ Cox's gperftools-httpd, a simple http server based on thttpd that enables remote profiling via google-perftool's pprof.
Brett Viren's Perftools project at the Brookhaven National Laboratory -- a similar project with the same name as Google's. [docs], [download]
Questions and Feedback
While this wiki page allows comments, I don't check it very often. If you have questions, comments, or feedback, please direct them to [email protected].