Geometry Curve of OpenCascade BRep
Geometry Curve of OpenCascade BRep
摘要Abstract:几何曲线是参数表示的曲线 ,在边界表示中其数据存在于BRep_TEdge中,BRep_TEdge中不仅包括了几何曲线,还包含其他类型的几何信息。本文主要对OpenCascade的BRep表示中几何曲线进行说明,将在后面分析Topology部分的读写程序时来说明这三种拓朴结构中分别包括哪些几何信息。
关键字Key Words:OpenCascade BRep, Geometry Curve, Topology, Refactoring
一、引言 Introduction
边界表示(Boundary Representation)也称为BRep表示,它是几何造型中最成熟、无二义的表示法。实体的边界通常是由面的并集来表示,而每个面又由它所在的曲面的定义加上其边界来表示,面的边界是边的并集,而边又是由点来表示的。
边界表示的一个重要特征是描述形体的信息包括几何信息(Geometry)和拓朴信息(Topology)两个方面。拓朴信息描述形体上的顶点、边、面的连接关系,它形成物体边界表示的“骨架”。形体的几何信息犹如附着在“骨架”上的肌肉。例如,形体的某个面位于某一个曲面上,定义这一曲面方程的数据就是几何信息。此外,边的形状、顶点在三维空间中的位置(点的坐标)等都是几何信息,一般来说,几何信息描述形体的大小、尺寸、位置和形状等。
OpenCascade中几何(Geometry)与拓朴(Topology)的关系也是按上述方式组织的。即几何信息在BRep中并不是单独存在的,而是依附于拓朴存在的。通过继承TopoDS包中的抽象的拓朴类实现了边界表示(BRep)模型。如下图所示:
Figure 1.1 Topology data structure in OpenCascade
从上面的类图可以看出只有三种拓朴对象有几何数据:顶点(vertex)、边(edge)、面(face),分别为BRep_TVertex、BRep_TEdge、BRep_TFace。BRep_TVertex中主要包含一个空间点(x, y, z)数据;几何曲线数据主要存在于BRep_TEdge中,BRep_TEdge中不仅包括了几何曲线,还包含其他类型的几何信息;BRep_TFace中主要包含几何曲面及其他的几何数据,如面的三角剖分等。本文主要对OpenCascade的BRep表示中几何曲线进行说明,将在后面分析Topology部分的读写程序时来说明这三种拓朴结构中分别包括哪些几何信息。
Draw Test Harness是OpenCascade提供的一种灵活和简便的测试与演示OCCT造型库的工具。他不仅可以使用交互的方式来创建、显示和修改曲线、曲面和拓朴形状,还可以以脚本(script)的方式来使用,OpenCascade就是用脚本的方式来对其造型内核进行自动化测试(Tests)。本文将示例程序的几何曲线在Draw Test Harness进行创建与显示,结合图形的直观显示便于对抽象概念的理解。
二、示例程序 Example Code
在OpenCascade提供的文档《BRep Format Description White Paper》对其BRep文件数据进行了说明。BRep文件的几何部分包含了三维曲线,根据文档中提供的数据,利用其提供的类来将示例数据进行输出,再调试其相关代码来分析其实现。示例程序如下所示:
/*
*    Copyright (c) 2013 eryar All Rights Reserved.
*
*        File    : Main.cpp
*        Author  : [email protected]
*        Date    : 2013-11-11 21:46
*        Version : 1.0v
*
*    Description : Demonstrate the geometry 3d curve section
*                  of the BRep file of OpenCascade.
*
*       KeyWords : OpenCascade, BRep File, Geometry Curve
*
*/

// OpenCascade library.
#define WNT
#include <Geom_Line.hxx>
#include <Geom_Circle.hxx>
#include <Geom_Ellipse.hxx>
#include <Geom_Parabola.hxx>
#include <Geom_Hyperbola.hxx>
#include <Geom_BezierCurve.hxx>
#include <Geom_BSplineCurve.hxx>
#include <Geom_TrimmedCurve.hxx>
#include <Geom_OffsetCurve.hxx>

#include <TColgp_Array1OfPnt.hxx>
#include <TColStd_Array1OfReal.hxx>
#include <TColStd_Array1OfInteger.hxx>

#include <GeomTools.hxx>
#include <GeomTools_CurveSet.hxx>

#pragma comment(lib, "TKernel.lib")
#pragma comment(lib, "TKMath.lib")
#pragma comment(lib, "TKG3d.lib")
#pragma comment(lib, "TKGeomBase.lib")

int main(void)
{
    gp_Ax2 axis(gp_Pnt(1, 2, 3), gp::DZ());
    std::ofstream dumpFile("geometryCurve.txt");

    // 3D curve record 1: Line.
    // Example: 1 1 0 3 0 1 0
    Handle_Geom_Line theLine = new Geom_Line(gp_Pnt(1, 0, 3), gp_Dir(0, 1, 0));
    GeomTools::Write(theLine, dumpFile);
    GeomTools::Dump(theLine, dumpFile);
    GeomTools::Dump(theLine, std::cout);

    // 3D curve record 2: Circle.
    // Example: 2 1 2 3 0 0 1 1 0 -0 -0 1 0 4
    Handle_Geom_Circle theCircle = new Geom_Circle(axis, 4.0);
    GeomTools::Write(theCircle, dumpFile);
    GeomTools::Dump(theCircle, dumpFile);
    GeomTools::Dump(theCircle, std::cout);

    // 3D curve record 3: Ellipse.
    // Example: 3 1 2 3 0 0 1 1 0 -0 -0 1 0 5 4
    Handle_Geom_Ellipse theEllipse = new Geom_Ellipse(axis, 5.0, 4.0);
    GeomTools::Write(theEllipse, dumpFile);
    GeomTools::Dump(theEllipse, dumpFile);
    GeomTools::Dump(theEllipse, std::cout);

    // 3D curve record 4: Parabola.
    // Example: 4 1 2 3 0 0 1 1 0 -0 -0 1 0 16
    Handle_Geom_Parabola theParabola = new Geom_Parabola(axis, 16.0);
    GeomTools::Write(theParabola, dumpFile);
    GeomTools::Dump(theParabola, dumpFile);
    GeomTools::Dump(theParabola, std::cout);

    // 3D curve record 5: Hyperbola.
    // Example: 5 1 2 3 0 0 1 1 0 -0 -0 1 0 5 4
    Handle_Geom_Hyperbola theHyperbola = new Geom_Hyperbola(axis, 5.0, 4.0);
    GeomTools::Write(theHyperbola, dumpFile);
    GeomTools::Dump(theHyperbola, dumpFile);
    GeomTools::Dump(theHyperbola, std::cout);

    // 3D curve record 6: Bezier Curve.
    // Example: 6 1 2 0 1 0  4 1 -2 0  5 2 3 0  6
    TColgp_Array1OfPnt poles(1, 3);
    TColStd_Array1OfReal weights(1, 3);

    poles.SetValue(1, gp_Pnt(0, 1, 0));
    poles.SetValue(2, gp_Pnt(1, -2, 0));
    poles.SetValue(3, gp_Pnt(2, 3, 0));

    weights.SetValue(1, 4.0);
    weights.SetValue(2, 5.0);
    weights.SetValue(3, 6.0);

    Handle_Geom_BezierCurve theBezierCurve = new Geom_BezierCurve(poles, weights);
    GeomTools::Write(theBezierCurve, dumpFile);
    GeomTools::Dump(theBezierCurve, dumpFile);
    GeomTools::Dump(theBezierCurve, std::cout);

    // 3D curve record 7: B-Spline Curve.
    // Example: 7 1 0  1 3 5  0 1 0  4 1 -2 0  5 2 3 0  6
    //          0 1 0.25 1 0.5 1 0.75 1 1 1
    Standard_Integer degree = 1;
    TColStd_Array1OfReal knots(1, 5);
    TColStd_Array1OfInteger multiplicities(1, 5);

    knots.SetValue(1, 0);
    knots.SetValue(2, 0.25);
    knots.SetValue(3, 0.5);
    knots.SetValue(4, 0.75);
    knots.SetValue(5, 1.0);

    // all knots multiplicity of the B-spline is 1.
    multiplicities.Init(1);

    Handle_Geom_BSplineCurve theBSplineCurve = new Geom_BSplineCurve(poles, weights, knots, multiplicities, degree);
    GeomTools::Write(theBSplineCurve, dumpFile);
    GeomTools::Dump(theBSplineCurve, dumpFile);
    GeomTools::Dump(theBSplineCurve, std::cout);

    // 3D curve record 8: Trimmed Curve.
    // Example: 8 -4 5
    //          1 1 2 3 1 0 0
    Handle_Geom_Line theBaseCurve = new Geom_Line(gp_Pnt(1, 2, 3), gp_Dir(1, 0, 0));
    Handle_Geom_TrimmedCurve theTrimmedCurve = new Geom_TrimmedCurve(theBaseCurve, -4, 5);
    GeomTools::Write(theTrimmedCurve, dumpFile);
    GeomTools::Dump(theTrimmedCurve, dumpFile);
    GeomTools::Dump(theTrimmedCurve, std::cout);

    // 3D curve record 9: Offset Curve.
    // Example: 9 2
    //          0 1 0
    //          1 1 2 3 1 0 0
    Handle_Geom_OffsetCurve theOffsetCurve = new Geom_OffsetCurve(theBaseCurve, 2.0, gp::DY());
    GeomTools::Write(theOffsetCurve, dumpFile);
    GeomTools::Dump(theOffsetCurve, dumpFile);
    GeomTools::Dump(theOffsetCurve, std::cout);

    return 0;
}
上述程序将《BRep Format Description White Paper》中的几何部分(Geometry Section)的三维曲线(3D Curves)示例数据分别使用类GeomTools的静态函数输出到屏幕和文件。
当使用GeomTools::Write()时输出的内容与BRep文件中一致,当使用GeomTools::Dump()时输出更易读的信息。为了便于对比理解,将两种形式都输出到文件geometryCurve.txt中,输出数据如下所示:
1 1 0 3 0 1 0
Line
  Origin :1, 0, 3
  Axis   :0, 1, 0

2 1 2 3 0 0 1 1 0 -0 -0 1 0 4
Circle
  Center :1, 2, 3
  Axis   :0, 0, 1
  XAxis  :1, 0, -0
  YAxis  :-0, 1, 0
  Radius :4

3 1 2 3 0 0 1 1 0 -0 -0 1 0 5 4
Ellipse
  Center :1, 2, 3
  Axis   :0, 0, 1
  XAxis  :1, 0, -0
  YAxis  :-0, 1, 0
  Radii  :5, 4

4 1 2 3 0 0 1 1 0 -0 -0 1 0 16
Parabola
  Center :1, 2, 3
  Axis   :0, 0, 1
  XAxis  :1, 0, -0
  YAxis  :-0, 1, 0
  Focal  :16

5 1 2 3 0 0 1 1 0 -0 -0 1 0 5 4
Hyperbola
  Center :1, 2, 3
  Axis   :0, 0, 1
  XAxis  :1, 0, -0
  YAxis  :-0, 1, 0
  Radii  :5, 4

6 1 2 0 1 0  4 1 -2 0  5 2 3 0  6
BezierCurve rational
  Degree :2
   1 : 0, 1, 0  4
   2 : 1, -2, 0  5
   3 : 2, 3, 0  6

7 1 0  1 3 5  0 1 0  4 1 -2 0  5 2 3 0  6
 0 1 0.25 1 0.5 1 0.75 1 1 1
BSplineCurve rational
  Degree 1, 3 Poles, 5  Knots
Poles :

   1 : 0, 1, 0  4
   2 : 1, -2, 0  5
   3 : 2, 3, 0  6
Knots :

   1 :  0 1
   2 :  0.25 1
   3 :  0.5 1
   4 :  0.75 1
   5 :  1 1

8 -4 5
1 1 2 3 1 0 0
Trimmed curve
Parameters : -4 5
Basis curve :
Line
  Origin :1, 2, 3
  Axis   :1, 0, 0

9 2
0 1 0
1 1 2 3 1 0 0
OffsetCurveOffset : 2
Direction : 0, 1, 0
Basis curve :
Line
  Origin :1, 2, 3
  Axis   :1, 0, 0
三、程序说明 Example Description
3.1 直线 Line
示例:
    // 3D curve record 1: Line.
    // Example: 1 1 0 3 0 1 0
    Handle_Geom_Line theLine = new Geom_Line(gp_Pnt(1, 0, 3), gp_Dir(0, 1, 0));
    GeomTools::Write(theLine, dumpFile);
<3D curve record 1>描述的直线数据包含一个三维点P和三维方向D,其参数方程为:
示例数据表示的直线为经过点(1,0,3)且方向D为(0,1,0)的直线,其参数方程表示为:
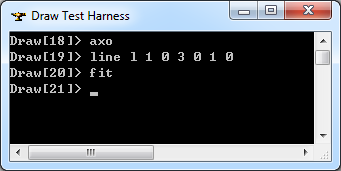
在Draw Test Harness中创建并显示直线如下所示:
3.2 圆 Circle
示例:
    // 3D curve record 2: Circle.
    // Example: 2 1 2 3 0 0 1 1 0 -0 -0 1 0 4
    gp_Ax2 axis(gp_Pnt(1, 2, 3), gp::DZ());
    Handle_Geom_Circle theCircle = new Geom_Circle(axis, 4.0);
    GeomTools::Write(theCircle, dumpFile);
<3D curve record 2>描述的圆的数据包含表示圆心坐标的三维点P,三个方向N,Dx,Dy表示的坐标系和半径r。其参数方程如下所示:
示例数据表示的圆是圆心坐标为(1,2,3),半径r为(4),圆所在平面的法向N为(0,0,1),圆的X方向(1,0,0)和Y方向为(0,1,0),其参数方程为:
在Draw Test Harness中创建并显示圆如下所示:
3.3 椭圆 Ellipse
示例:
    // 3D curve record 3: Ellipse.
    // Example: 3 1 2 3 0 0 1 1 0 -0 -0 1 0 5 4
    Handle_Geom_Ellipse theEllipse = new Geom_Ellipse(axis, 5.0, 4.0);
    GeomTools::Write(theEllipse, dumpFile);
<3D curve record 3>定义了椭圆。椭圆的数据包含三维点P,三维正交坐标系N、Dmaj、Dmin和两个非负实数rmaj和rmin,且rmin<=rmaj。椭圆位于中心点P,法向量为N的平面上,且长轴、短轴的方向分别为Dmaj, Dmin,长轴、短轴上的半径分别为rmaj, rmin。椭圆的参数方程定义如下所示:
示例数据表示的椭圆的中心点P=(1,2,3),平面的法向量N=(0,0,1),长轴方向Dmaj=(1,0,-0),短轴方向Dmin=(-0,1,0),长轴半径为5,短轴半径为4,
在Draw Test Harness中创建并显示椭圆如下所示:
3.4 抛物线 Parabola
示例:
    // 3D curve record 4: Parabola.
    // Example: 4 1 2 3 0 0 1 1 0 -0 -0 1 0 16
    Handle_Geom_Parabola theParabola = new Geom_Parabola(axis, 16.0);
  GeomTools::Write(theParabola, dumpFile);
<3D curve record 4>定义了抛物线。抛物线数据包含三维点P,三维正交坐标系坐标轴方向N,Dx,Dy和一个非负的实数f。抛物线通过点P,且位于法向量为N的平面上,焦点长度为f,其参数方程如下所示:
示例数据表示的抛物线过点P=(1,2,3),位于平面的法向N=(0,0,1),抛物线的另两个轴方向Dx=(1,0,-0),Dy=(-0,1,0),焦点长度f=16。参数方程为:
在Draw Test Harness中创建并显示抛物线如下所示:
3.5 双曲线 Hyperbola
示例:
    // 3D curve record 5: Hyperbola.
    // Example: 5 1 2 3 0 0 1 1 0 -0 -0 1 0 5 4
    Handle_Geom_Hyperbola theHyperbola = new Geom_Hyperbola(axis, 5.0, 4.0);
    GeomTools::Write(theHyperbola, dumpFile);
<3D curve record 5>定义了双曲线。双曲线定义数据有三维点P,三维正交坐标系坐标轴方向为N,Dx,Dy和两个非负实数Kx,Ky。双曲线过P点且法向量为N的平面上,其参数方程如下所示:
示例数据表示的双曲线过点P=(1,2,3)且位于的平面的法向N=(0,0,1),其它的数据Dx=(1,0,-0),Dy=(-0,1,0),Kx=5和Ky=4。其参数方程为:
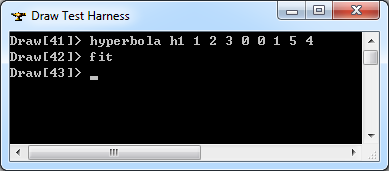
在Draw Test Harness中创建并显示双曲线如下所示:
3.6 Bezier曲线 Bezier Curve
示例:
// 3D curve record 6: Bezier Curve.
// Example: 6 1 2 0 1 0  4 1 -2 0  5 2 3 0  6
TColgp_Array1OfPnt poles(1, 3);
TColStd_Array1OfReal weights(1, 3);

poles.SetValue(1, gp_Pnt(0, 1, 0));
poles.SetValue(2, gp_Pnt(1, -2, 0));
poles.SetValue(3, gp_Pnt(2, 3, 0));

weights.SetValue(1, 4.0);
weights.SetValue(2, 5.0);
weights.SetValue(3, 6.0);

Handle_Geom_BezierCurve theBezierCurve = new Geom_BezierCurve(poles, weights);
GeomTools::Write(theBezierCurve, dumpFile);
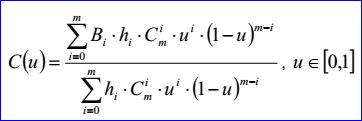
<3D curve record 6>定义了Bezier曲线。Bezier曲线数据包含有理标志r,曲线的次数m(degree m <= 25查看源代码可知OpenCascade可处理的B样条次数不超过25)和带权的控制点(weight poles)。当有理标志位r=0时,weight poles就是m+1个三维点:B0,B1...Bn;当有理标志位r=1时,weight poles就是带权的控制点B0 h0... Bm hm。Bi是三维点,hi是[0,m]正实数,即权因子。当有理标志位r=0时,即不是有理Bezier曲线时,hi=1。Bezier曲线参数方程如下所示:
示例数据表示的Bezier曲线是有理Bezier曲线,因其有理标志位r=1,次数m=2,带权控制点及权因子分别为:B0=(0,1,0),h0=4,B1=(1,-2,0),h1=5,B2=(2,3,0),h2=6。Bezier曲线的参数方程如下所示:
在Draw Test Harness中创建并显示Bezier曲线如下所示:
3.7 B样条曲线 B-Spline Curve
示例:
// 3D curve record 7: B-Spline Curve.
// Example: 7 1 0  1 3 5  0 1 0  4 1 -2 0  5 2 3 0  6
//          0 1 0.25 1 0.5 1 0.75 1 1 1
Standard_Integer degree = 1;
TColStd_Array1OfReal knots(1, 5);
TColStd_Array1OfInteger multiplicities(1, 5);

knots.SetValue(1, 0);
knots.SetValue(2, 0.25);
knots.SetValue(3, 0.5);
knots.SetValue(4, 0.75);
knots.SetValue(5, 1.0);

// all knots multiplicity of the B-spline is 1.
multiplicities.Init(1);

Handle_Geom_BSplineCurve theBSplineCurve = new Geom_BSplineCurve(poles, weights, knots, multiplicities, degree);
GeomTools::Write(theBSplineCurve, dumpFile);
<3D curve record 7>定义了B-Spline曲线。B-Spline曲线包含了有理标志位r,曲线次数m<=25,控制点数n>=2,节点数k,带权控制点wieght poles和节点重数multiplicity knots。
当有理标志位r=0时,是非有理B样条曲线,weight poles有n个三维点B1,...,Bn;当有理标志位r=1时,是有理B样条曲线,weight poles是n个带权控制点对:B1, h1, .... Bn, hn。这里Bi表示一个三维点,hi表示一个[0,1]正实数。当有理标志位r=0时,hi=1。
重节点有k对u1, q1, ... uk, qk。这里ui是重复度为qi>=1的节点。
B-Spline曲线的参数方程如下所示:
其中基函数Ni,j有如下的递归定义:
示例数据表示的B样条曲线为:有理标志位r=1,次数m=1,控制点数n=3,节点数k=5,带权控制点:B1=(0,1,0),h1=4,B2=(1,-2,0),h2=5,B3=(2,3,0),h3=6;节点及其重数u1=0,q1=1,u2=0.25,q2=1,u3=0.5,q3=1,u4=0.75,q4=1,u5=1,q5=1。B-Spline曲线的参数方程如下所示:
在Draw Test Harness中创建并显示B-Spline曲线如下所示:
3.8 裁剪曲线 Trimmed Curve
示例:
// 3D curve record 8: Trimmed Curve.
// Example: 8 -4 5
//          1 1 2 3 1 0 0
Handle_Geom_Line theBaseCurve = new Geom_Line(gp_Pnt(1, 2, 3), gp_Dir(1, 0, 0));
Handle_Geom_TrimmedCurve theTrimmedCurve = new Geom_TrimmedCurve(theBaseCurve, -4, 5);
GeomTools::Write(theTrimmedCurve, dumpFile);
<3D curve record 8>定义了裁剪曲线(trimmed curve)。裁剪曲线数据包含:两个实数umin,umax和<3D curve record>,且umin<umax。裁剪曲线是将<3D curve record>描述的曲线B限制在[umin,umax]。裁剪曲线的参数方程如下所示:
示例数据表示的裁剪曲线为:umin=-4,umax=5,曲线B(u)=(1,2,3)+u(1,0,0)。裁剪曲线的参数方程如下所示:
3.9 偏移曲线 Offset Curve
示例:
 // 3D curve record 9: Offset Curve.
 // Example: 9 2
 //          0 1 0
 //          1 1 2 3 1 0 0
 Handle_Geom_OffsetCurve theOffsetCurve = new Geom_OffsetCurve(theBaseCurve, 2.0, gp::DY());
 GeomTools::Write(theOffsetCurve, dumpFile);
<3D curve record 9>定义了偏移曲线(offset curve)。偏移曲线的数据包含偏移距离d,偏移方向D和曲线数据<3D curve record>。偏移曲线是将<3D curve record>描述的曲线沿矢量![]() 偏移距离d后的结果。偏移曲线的参数方程如下所示:
偏移距离d后的结果。偏移曲线的参数方程如下所示:
示例数据表示的偏移曲线为偏移距离d=2,方向D=(0,1,0),基曲线B(u)=(1,2,3)+u(1,0,0),其参数方程如下所示:
四、程序分析 Refactoring the Code
Figure 4.1 Class diagram of Geom_Curve
根据几何曲线的类图可知,几何曲线有个共同的基类Geom_Curve。而在对几何数据进行输出与读入时,用了很多条件判断。输出部分程序代码如下所示:
//=======================================================================
//function : Print
//purpose  :
//=======================================================================
void GeomTools_CurveSet::PrintCurve(const Handle(Geom_Curve)& C,
                    Standard_OStream& OS,
                    const Standard_Boolean compact)
{
  Handle(Standard_Type) TheType = C->DynamicType();

  if ( TheType ==STANDARD_TYPE(Geom_Line)) {
    Print(Handle(Geom_Line)::DownCast(C),OS,compact);
  }
  else if ( TheType ==  STANDARD_TYPE(Geom_Circle)) {
    Print(Handle(Geom_Circle)::DownCast(C),OS,compact);
  }
  else if ( TheType == STANDARD_TYPE(Geom_Ellipse)) {
    Print(Handle(Geom_Ellipse)::DownCast(C),OS,compact);
  }
  else if ( TheType == STANDARD_TYPE(Geom_Parabola)) {
    Print(Handle(Geom_Parabola)::DownCast(C),OS,compact);
  }
  else if ( TheType == STANDARD_TYPE(Geom_Hyperbola)) {
    Print(Handle(Geom_Hyperbola)::DownCast(C),OS,compact);
  }
  else if ( TheType == STANDARD_TYPE(Geom_BezierCurve)) {
    Print(Handle(Geom_BezierCurve)::DownCast(C),OS,compact);
  }
  else if ( TheType == STANDARD_TYPE(Geom_BSplineCurve)) {
    Print(Handle(Geom_BSplineCurve)::DownCast(C),OS,compact);
  }
  else if ( TheType == STANDARD_TYPE(Geom_TrimmedCurve)) {
    Print(Handle(Geom_TrimmedCurve)::DownCast(C),OS,compact);
  }
  else if ( TheType == STANDARD_TYPE(Geom_OffsetCurve)) {
    Print(Handle(Geom_OffsetCurve)::DownCast(C),OS,compact);
  }
  else {
    GeomTools::GetUndefinedTypeHandler()->PrintCurve(C,OS,compact);
    //if (!compact)
    //  OS << "****** UNKNOWN CURVE TYPE ******\n";
    //else
    //  cout << "****** UNKNOWN CURVE TYPE ******" << endl;
  }
}
读入部分的程序代码如下所示:
//=======================================================================
//function : ReadCurve
//purpose  :
//=======================================================================
Standard_IStream& GeomTools_CurveSet::ReadCurve(Standard_IStream& IS,
                        Handle(Geom_Curve)& C)
{
  Standard_Integer ctype;

  try {
    OCC_CATCH_SIGNALS
    IS >> ctype;
    switch (ctype) {

    case LINE :
      {
        Handle(Geom_Line) CC;
        IS >> CC;
        C = CC;
      }
      break;

    case CIRCLE :
      {
        Handle(Geom_Circle) CC;
        IS >> CC;
        C = CC;
      }
      break;

    case ELLIPSE :
      {
        Handle(Geom_Ellipse) CC;
        IS >> CC;
        C = CC;
      }
      break;

    case PARABOLA :
      {
        Handle(Geom_Parabola) CC;
        IS >> CC;
        C = CC;
      }
      break;

    case HYPERBOLA :
      {
        Handle(Geom_Hyperbola) CC;
        IS >> CC;
        C = CC;
      }
      break;

    case BEZIER :
      {
        Handle(Geom_BezierCurve) CC;
        IS >> CC;
        C = CC;
      }
      break;

    case BSPLINE :
      {
        Handle(Geom_BSplineCurve) CC;
        IS >> CC;
        C = CC;
      }
      break;

    case TRIMMED :
      {
        Handle(Geom_TrimmedCurve) CC;
        IS >> CC;
        C = CC;
      }
      break;

    case OFFSET :
      {
        Handle(Geom_OffsetCurve) CC;
        IS >> CC;
        C = CC;
      }
      break;

    default:
      {
        Handle(Geom_Curve) CC;
        GeomTools::GetUndefinedTypeHandler()->ReadCurve(ctype,IS,CC);
        C = CC;
      }
    }
  }
  catch(Standard_Failure) {
#ifdef DEB
    Handle(Standard_Failure) anExc = Standard_Failure::Caught();
    cout <<"EXCEPTION in GeomTools_CurveSet::ReadCurve(..)!!!" << endl;
    cout << anExc << endl;
#endif
    C = NULL;
  }
  return IS;
}
正如《Refactoring-Improving the Design of Existing Code》书中以多态取代条件表达式(Replace Conditional with Polymorphism)所说,在面向对象术语中,听上去最高贵的词非“多态”莫属。多态最根本的好处就是如果你需要根据对象的不同类型而采取不同的行为,多态使你不必编写明显的条件表达式。正因为有了多态,所以你会发现“类型码的switch语句”以及“基于类型名称的if-then-else语句”在面向对象程序中很少出现。
多态能够带给你很多好处。如果同一组条件表达式在程序许多地方出现,那么使用多态的收益是最大的。使用条件表达式时,如果你想添加一种新类型,就必须查找并更新所有条件表达式。但如果改用多态,只需要一个新的子类,并在其中提供适当的函数就行了。类的用户不需要了解这个子类,这就大降低了系统各部分之间的依赖,使系统升级更容易。
OpenCascade的几何曲线已经有一个基类Geom_Curve了,可将输出做为虚函数,就不需要做判断了。在读入(创建)时引入工厂模式,对于UndefinedTypeHandler()可以引入Null对象。经过这样重构之后的程序可读性应该会更好吧!
五、结论 Conclusion
在边界表示BRep的形状中,参数表示的几何曲线并不会孤立存在,他总是依附于拓朴边中。在OpenCascade的BRep格式的文件中三维几何曲线共有九种,通过将这九种几何曲线输出,理解参数表示的几何曲线的数据结构。
通过查看其读写几何曲线的源程序,提出重构的方法。当在面向对象的程序中出现很条件表达式时,那么程序就有“坏味道”了,需要进行重构改进。
六、参考资料 References
1. OpenCascade. BRep Format Description White Paper
2. Martin Fowler. Refactoring:Improving the Design of Existing Code. Addison-Wesley
3. Les Piegl, Wayne Tiller. The NURBS Book. Springer-Verlag
PDF Version: Geometry Curve of OpenCascade BRep


